


 United States
United States
United States
 Interactive data profiles:
 |
|
|
|
|
|
|
|
|
|
|
|
|
|
|
|
|
|
|
|
|
|
|
|
|
|
|
|
|
|
|
|
|
|
|
|
|
|
|
|
|
|
|
|
|
|
|
|
|
|
|
|
|
|
|
|
|
|
|
|
|
|
|
|
|
|
|
|
|
|
|
|
|
|
|
|
|
|
|
|
|
|
|
|
|
|
|
|
|
|
|
|
|
|
|
|
|
|
|
|
|
|
|
|
|
|
|
|
|
|
|
|
|
|
|
|
|
|
|
|
|
|
|
|
|
|
|
|
|
|
|
|
|
|
|
|
|
|
|
|
|
|
|
|
|
|
|
|
|
|
|
|
|
|
|
|
|
|
|
|
|
|
|
|
|
|
|
|
|
|
|
|
|
|
|
|
|
|
|
|
|
|
|
|
|
|
|
|
|
|
|
|
|
|
|
|
|
|
|
|
|
|
|
|
|
|
|
|
|
|
|
|
|
|
|
|
|
|
|
|
|
|
|
|
|
|
|
|
|
|
|
|
|
|
|
|
|
|
|
|
|
|
|
|
|
|
|
|
|
|
|
|
|
|
|
|
|
|
|
|
|
|
|
|
|
|
|
|
|
|
|
|
|
|
|
|
|
|
|
|
|
|
|
|
|
|
|
|
|
|
|
|
|
|
|
|
|
|
|
|
|
|
|
|
|
|
|
|
|
|
|
|
|
|
|
|
|
|
|
|
|
|
|
|
|
|
|
|
|
|
|
|
|
|
|
|
|
|
|
|
|
|
|
|
|
|
|
|
|
|
|
|
|
|
|
|
|
|
|
|
|
|
|
|
|
|
|
|
|
|
|
|
|
|
|
|
|
|
|
|
|
|
|
|
|
|
|
|
|
|
|
|
|
|
|
|
|
|
|
|
|
|
|
|
|
|
|
|
|
|
|
|
|
|
|
|
|
|
|
|
|
|
|
|
|
|
|
|
|
|
|
|
|
|
|
|
|
|
|
|
|
|
|
|
|
|
|
|
|
|
|
|
|
|
|
|
|
|
|
|
|
|
|
|
|
|
|
|
|
|
|
|
|
|
|
|
|
|
|
|
|
|
|
|
|
|
|
|
|
|
|
|
|
|
|
 Country reports and publications
United States
Adult skills (Survey of Adult Skills, PIAAC, 2023)
| Country note | Survey of Adult Skills (PIAAC) | Survey of Adult Skills 2023: Do Adults Have the Skills They Need to Thrive in a Changing World? | The Survey of Adult Skills - Reader's Companion | Understanding Skill Gaps in Firms: Results of the PIAAC Employer Module | Survey of Adult Skills 2023 Data Analysis Manual |

Select first some countries to compare, choose the charts you wish to display and customise them.
The following list displays indicators for which your selected country shows the highest and lowest values among countries.
The list can be sorted by level of education or by age group. All rankings are calculated including available data from OECD
and partner countries.
Find out more about the methodology here.
Show indicators for which your country ranks among the top or bottom:
Sort by:
Numeracy
The percentage of adults scoring at or below level 1 in numeracy is high compared to other countries participating in the Survey of Adult Skills (PIAAC). (34.2 %, rank 5/31 , 2023) Download Indicator
Skills differences between age groups
The mean numeracy score for young adults (16-24 year-olds) is low compared to other countries participating in the Survey of Adult Skills (PIAAC). (248 PIAAC Score, rank 29/31 , 2023) Download Indicator
Skills differences by level of education
The mean score in adaptive problem solving for adults with below upper secondary education is low compared to other countries participating in the Survey of Adult Skills (PIAAC). (188 PIAAC Score, rank 30/31 , 2023) Download Indicator
The mean literacy score for adults without upper secondary education is low compared to other countries participating in the Survey of Adult Skills (PIAAC). (183 PIAAC Score, rank 29/31 , 2023) Download Indicator
The mean numeracy score for adults without upper secondary education is low compared to other countries participating in the Survey of Adult Skills (PIAAC). (170 PIAAC Score, rank 30/31 , 2023) Download Indicator
The mean numeracy score for adults with an upper secondary education is low compared to other countries participating in the Survey of Adult Skills (PIAAC). (227 PIAAC Score, rank 29/31 , 2023) Download Indicator
Skills by immigrant and language background
The mean literacy score for native-born adults of foreign-born parents is low compared to other countries participating in the Survey of Adult Skills (PIAAC). (248 PIAAC Score, rank 20/24 , 2023) Download Indicator
The mean numeracy score for native-born adults of foreign-born parents is low compared to other countries participating in the Survey of Adult Skills (PIAAC). (235 PIAAC Score, rank 22/24 , 2023) Download Indicator
Skills by parents' educational attainment
The mean literacy score for adults whose parents had not attained upper secondary education is low compared to other countries participating in the Survey of Adult Skills (PIAAC). (214 PIAAC Score, rank 27/31 , 2023) Download Indicator
The mean numeracy score for adults whose parents had not attained upper secondary education is low compared to other countries participating in the Survey of Adult Skills (PIAAC). (203 PIAAC Score, rank 30/31 , 2023) Download Indicator
The mean numeracy score with at least one parent with upper secondary education is low compared to other countries participating in the Survey of Adult Skills (PIAAC). (243 PIAAC Score, rank 28/31 , 2023) Download Indicator
Adults' skills
The change in mean literacy score, adjusted for demographic changes, in the Survey of Adult Skills (PIAAC) from 2012 to 2023 is low compared to other countries participating in the Survey of Adult Skills (PIAAC). (-10 PIAAC Score, rank 18/21 , 2023) Download Indicator
The change in mean numeracy score, adjusted for demographic changes, in the Survey of Adult Skills (PIAAC) from 2012 to 2023 is low compared to other countries participating in the Survey of Adult Skills (PIAAC). (-6 PIAAC Score, rank 18/21 , 2023) Download Indicator
Teachers' salaries
The ratio of pre-primary teachers' salaries to earnings of full-time, full-year workers with tertiary education is one of the lowest among OECD and partner countries with available data. (0.54 Ratio, rank 18/18 , 2023) Download Indicator
The ratio of primary teachers' salaries to earnings of full-time, full-year workers with tertiary education is one of the lowest among OECD and partner countries with available data. (0.54 Ratio, rank 19/19 , 2023) Download Indicator
The ratio of lower secondary teachers' salaries to earnings of full-time, full-year workers with tertiary education is one of the lowest among OECD and partner countries with available data. (0.56 Ratio, rank 19/19 , 2023) Download Indicator
The ratio of upper secondary teachers' salaries to earnings of full-time, full-year workers with tertiary education is one of the lowest among OECD and partner countries with available data. (0.57 Ratio, rank 20/20 , 2023) Download Indicator
The average actual pre-primary teacher's salary among teachers aged between 25-64 is one of the highest per hour of net teaching time among OECD and partner countries with available data. (66325 USD Equivalent, rank 5/28 , 2023) Download Indicator
After 15 years of experience, a pre-primary teacher with typical qualification can expect to have one of the highest salaries among OECD and partner countries with available data. (75635 USD Equivalent, rank 4/33 , 2023) Download Indicator
The ratio of lower secondary female teachers' salaries to earnings of full-time, full-year women workers with tertiary education is one of the lowest among OECD and partner countries with available data. (0.76 Ratio, rank 26/26 , 2023) Download Indicator
The ratio of lower secondary male teachers' salaries to earnings of full-time, full-year men workers with tertiary education is one of the lowest among OECD and partner countries with available data. (0.58 Ratio, rank 25/26 , 2023) Download Indicator
The salaries of 25-34 year-old general lower-secondary teachers relative to earnings for full-time, full-year similarly educated workers with tertiary education is low in United States. (0.7 Ratio, rank 25/27 , 2023) Download Indicator
The salaries of 55-64 year-old general lower-secondary teachers relative to earnings for full-time, full-year similarly educated workers with tertiary education is low in United States. (0.66 Ratio, rank 24/27 , 2023) Download Indicator
Principals' salaries
Lower-secondary 25-64 year-old school heads' salaries relative to earnings for full-time, full-year similarly educated workers with tertiary education is low in United States. (0.88 Ratio, rank 17/17 , 2023) Download Indicator
The average actual salaries of 25-64 year-old primary school heads is one of the highest in United States. (117560 USD Equivalent, rank 5/28 , 2023) Download Indicator
Ratio of student to teaching staff
In United States, the number of students per teacher in all public secondary education is one of the highest among OECD and partner countries with available data. (15.7 Ratio, rank 4/39 , 2023) Download Indicator
In United States, the number of students per teacher in private institutions tertiary education is one of the lowest among countries with available data. (11.1 Ratio, rank 32/34 , 2023) Download Indicator
Organisation of the education system
The total compulsory instruction time for primary students in United States is one of the longest among OECD and partner countries with available data. (5847 Hours, rank 5/42 , 2023) Download Indicator
Classes in lower secondary private institutions are comparatively small in United States. (15 Students, rank 30/34 , 2023) Download Indicator
In independent private institutions at lower secondary level, classes are one of the smallest in United States among OECD and partner countries with available data. (15 Students, rank 16/20 , 2023) Download Indicator
The data table will display up to six selected countries.
General findings
- In the 2023 Survey of Adult Skills, literacy is defined as "accessing, understanding, evaluating, and reflecting on written texts in order to achieve one's goals, to develop one's knowledge and potential, and to participate in society" (Rouet et al., 2021). Proficiency in literacy is crucial for adults across their personal, social and professional spheres, given the prevalence of written communication in various aspects of life. Throughout the day, adults engage in a diverse range of reading activities, spanning from delving into extensive pieces of continuous text to swiftly scanning pages for pertinent information. Examples include reading emails, leaflets, timetables and instruction manuals.
Visualisations
Click the arrow sign next to the title:
 to display other variables
to display other variables
Click the arrow sign next to the title:
to display other variables
to display other variables
Click the arrow sign next to the title:
to display other variables
to display other variables
- In the 2023 Survey of Adult Skills, numeracy encompasses "accessing, using, and reasoning critically with mathematical content, information and ideas represented in multiple ways in order to engage in and manage the mathematical demands of a range of situations in adult life" (Tout et al., 2021). The skills and knowledge needed for work and civic participation, and in more personal spheres of life, have changed. Individuals are presented with ever-increasing amounts of information of a quantitative or mathematical nature through online or technology-based resources, which have to be located, selected or filtered, interpreted, and at times questioned and doubted, and analysed for their relevance to the responses needed.
Visualisations
Click the arrow sign next to the title:
to display other variables
to display other variables
Click the arrow sign next to the title:
to display other variables
to display other variables
Click the arrow sign next to the title:
to display other variables
to display other variables
- The first cycle of the Survey of Adult Skills measured problem solving in technology-rich environments. This is defined as the ability to use digital technology, communication tools and networks to acquire and evaluate information, communicate with others and perform practical tasks. The survey assessed adults' ability to solve problems by establishing appropriate goals and plans, and accessing and using information through computers and computer networks.
In the 2023 Survey of Adult Skills, problem solving in technology-rich environments was replaced by adaptive problem solving (APS). This involves "the capacity to achieve one’s goals in a dynamic situation in which a method for solution is not immediately available. It requires engaging in cognitive and metacognitive processes to define the problem, search for information, and apply a solution in a variety of information environments and contexts" (Greiff et al., 2021).
APS has three important features. First, it emphasises individuals’ capacity to flexibly and dynamically adapt their problem-solving strategies to a dynamically changing environment. Second, it tests their ability to identify and select among a range of available physical, social and digital resources. Third, individuals need to monitor and reflect on their progress in solving problems, through metacognitive processes.
Visualisations
Click the arrow sign next to the title:
to display other variables
to display other variables
Click the arrow sign next to the title:
to display other variables
to display other variables
Click the arrow sign next to the title:
to display other variables
to display other variables
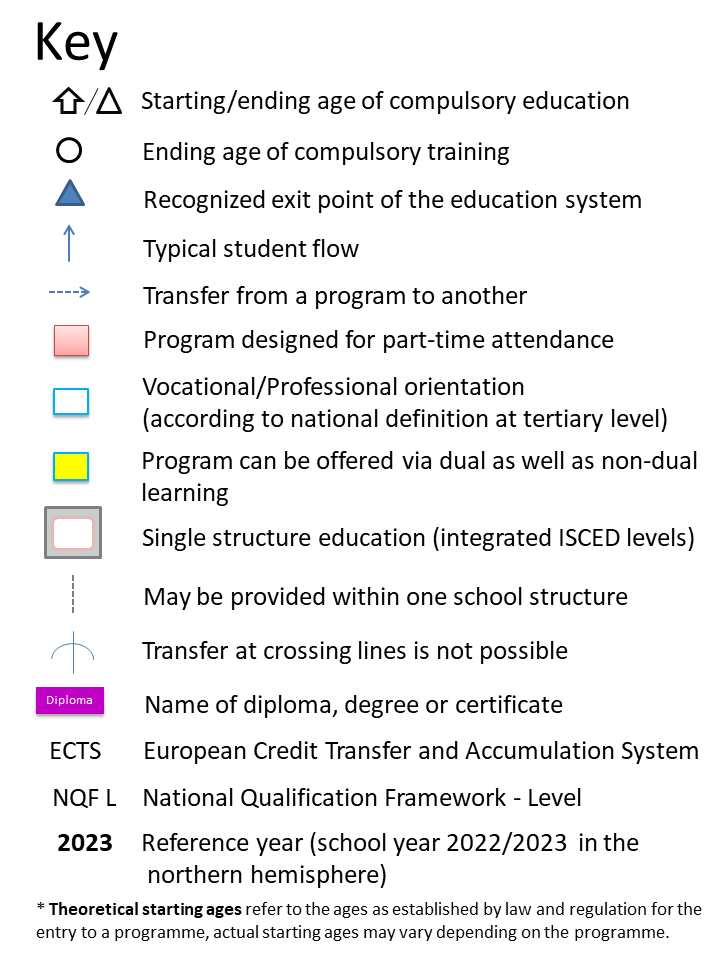
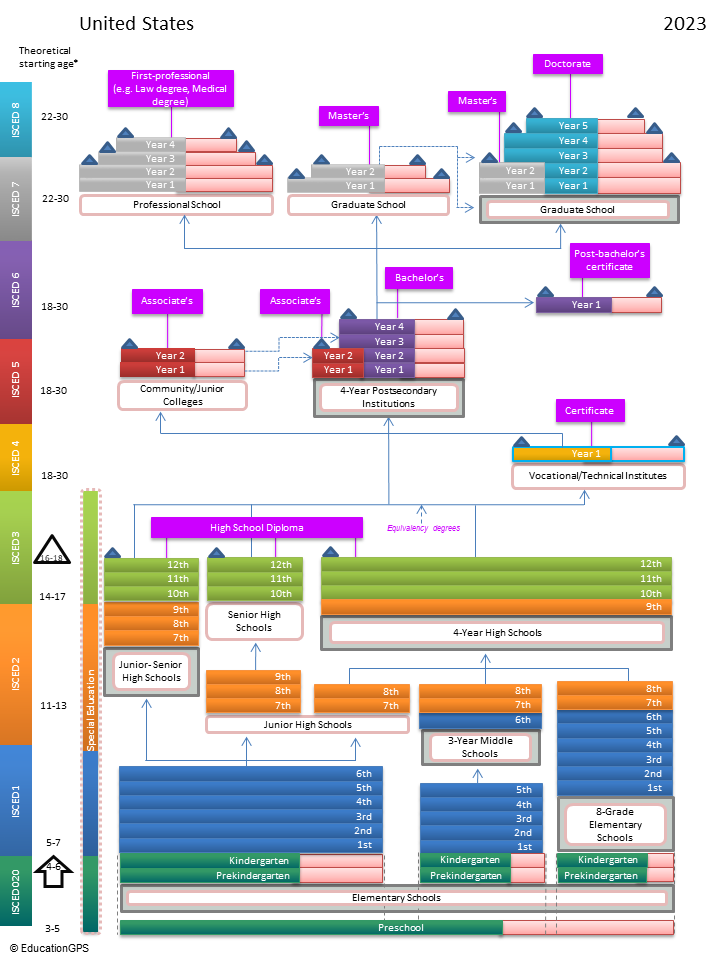
Click on the diagram to get a PDF version

Click on the coverpage to see the full OECD iLibrary version


Note: These values should be interpreted with care since they are influenced by countries' specific contexts and trade-offs. In education, there is often no simple
most- or least-efficient model. For instance, the share of private expenditure in education must be read against other measures designed to mitigate inequities,
such as loans and grants; longer learning time is an opportunity to convey more and better content to students, but may hinder investments in other important
areas. If you want further information on the nature of different variables, please take the time to read the analysis and contextual information, available at the website
for each publication.
All rankings for individual variables are compiled on the basis of OECD and G20 countries for which data are available. The OECD average includes only OECD countries which are listed here: https://www.oecd.org/en/about/members-partners.html
Reference years displayed in the Education GPS correspond to the most common year of reference among countries for which data is available on each variable. Data for the latest available year is preferred and some countries may have provided data refering to a more recent or late year. To know more about possible exceptions on data please click on the "Download Indicator" link on each variable. When a year of reference corresponds to a school year encompassing two years, the reference reads as follows: 2026 for school year 2025/2026.
*TALIS averages are based on all countries participating in the TALIS survey, including partner countries and economies. This explains the difference between the OECD average and the TALIS averages. Data from the TALIS survey and Education at a Glance (EAG) may differ. See Annex E of the TALIS technical report and Annex 3 of EAG 2024 for more details about the data collections.
For additional notes, please refer to annexes in the list of links below the introductory country profile text.
All rankings for individual variables are compiled on the basis of OECD and G20 countries for which data are available. The OECD average includes only OECD countries which are listed here: https://www.oecd.org/en/about/members-partners.html
Reference years displayed in the Education GPS correspond to the most common year of reference among countries for which data is available on each variable. Data for the latest available year is preferred and some countries may have provided data refering to a more recent or late year. To know more about possible exceptions on data please click on the "Download Indicator" link on each variable. When a year of reference corresponds to a school year encompassing two years, the reference reads as follows: 2026 for school year 2025/2026.
*TALIS averages are based on all countries participating in the TALIS survey, including partner countries and economies. This explains the difference between the OECD average and the TALIS averages. Data from the TALIS survey and Education at a Glance (EAG) may differ. See Annex E of the TALIS technical report and Annex 3 of EAG 2024 for more details about the data collections.
For additional notes, please refer to annexes in the list of links below the introductory country profile text.