Ukraine
Country overview



Country overview
Select a country to explore its education data and publications.
Explore education indicators through the available country profiles.
Read the latest OECD country notes, reviews and analysis.

Select first some countries to compare, choose the charts you wish to display and customise them.
After accounting for socio-economic status, the difference in reading performance between immigrant and non-immigrant students is one of the largest among PISA-participating countries and economies, in favour of non-immigrants. (-85 PISA Score, rank 69/71 , 2025) Download Indicator
After accounting for socio-economic status, the difference in science performance between non-immigrant and immigrant students is one of the largest among PISA-participating countries and economies, in favour of immigrants . (-77 PISA Score, rank 66/71 , 2025) Download Indicator
The percentage of students who have repeated a grade during primary, lower secondary or upper secondary school is one of the lowest among PISA-participating countries and economies. (1.8 %, rank 83/85 , 2025) Download Indicator
In Ukraine, the index of disciplinary climate in school science is relatively high. (0.5 PISA Index, rank 10/82 , 2025) Download Indicator
The share of students in schools whose principal reported that the use of cell phones is not allowed on the school premises is relatively low in Ukraine. (9.8 %, rank 86/88 , 2025) Download Indicator
In Ukraine, the share of students in schools whose principal reported banning cell phones and applying subject-specific guidelines was among the smallest across countries with available data. (7.8 %, rank 86/89 , 2025) Download Indicator
Compared to other PISA-participating countries and economies, the percentage of students who reported being bullied (made fun of by other students) at least a few times a month is relatively low. (7.1 %, rank 83/88 , 2025) Download Indicator
Ukraine ranked as one of the lowest-performing countries when comparing the share of students who reported never skipping a whole day of school in the two weeks prior to the PISA test. (41.5 %, rank 83/88 , 2025) Download Indicator
Compared to other OECD and partner countries/economies, students in Ukraine are not relatively curious, as measured by the PISA index of curiosity. (-0.32 PISA Index, rank 83/85 , 2025) Download Indicator
Ukraine had one of the strongest gender differences in favor of girls in the share of students who disagree that intelligence is something you cannot change much (boys-girls). (-5.9 % points, rank 42/47 , 2025) Download Indicator
The index of perseverance among students in Ukraine is relatively low compared to other PISA-participating countries and economies. (-0.21 PISA Index, rank 73/81 , 2025) Download Indicator
In Ukraine, the share of students who reported that they like to know how things work was among the smallest across countries with available data. (60.8 %, rank 84/86 , 2025) Download Indicator
The share of students who agreed or strongly agreed that they finish what they start was among the smallest in Ukraine compared with other countries with available data. (50.7 %, rank 80/87 , 2025) Download Indicator
The share of students who agreed or strongly agreed that they finish tasks they started even when they become boring placed Ukraine among countries with the smallest shares. (45.7 %, rank 78/87 , 2025) Download Indicator
The gender difference in the index of cognitive adaptability (boys - girls) placed Ukraine among countries with the widest differences in favor of girls. (-0.1 PISA Index, rank 39/47 , 2025) Download Indicator
Students in Ukraine spent among the longest amounts of time on digital devices per day for learning activities at school across countries with available data. (3 Hours, rank 1/88 , 2025) Download Indicator
Students in Ukraine spent among the longest amounts of time on digital devices per day for leisure at school across countries with available data. (2 Hours, rank 2/88 , 2025) Download Indicator
The change in science performance associated with students reporting that students get distracted by using digital resources in most or every school science lesson was among the smallest increases in Ukraine compared with other countries with available data, after accounting for student socio-economic status. (11 PISA Score points, rank 2/61 , 2025) Download Indicator
In 2025, the index of students' cognitive adaptability in Ukraine was one of the highest among PISA-participating countries and economies. (0.19 PISA Index, rank 9/80 , 2025) Download Indicator
Students in Ukraine show a high use of artificial intelligence for schoolwork. (0.31 PISA Index, rank 9/82 , 2025) Download Indicator
In Ukraine, a large share of students are learning to assess AI-generated information in class. (77.7 %, rank 6/82 , 2025) Download Indicator
In Ukraine, the difference between the shares of advantaged and disadvantaged students reporting that they assess the quality of information generated by AI chatbots in their school lessons sometimes or very often was among the narrowest across countries with available data. (5.1 %, rank 72/76 , 2025) Download Indicator
In Ukraine, a large share of students attend schools whose principal reported that the school's capacity to provide instruction is hindered to some extent or a lot by a lack of educational material. (60.9 %, rank 7/88 , 2025) Download Indicator
 to display other variables
to display other variables
to display other variables
to display other variables
to display other variables
to display other variables
to display other variables
to display other variables
to display other variables
to display other variables
to display other variables
to display other variables
to display other variables
to display other variables
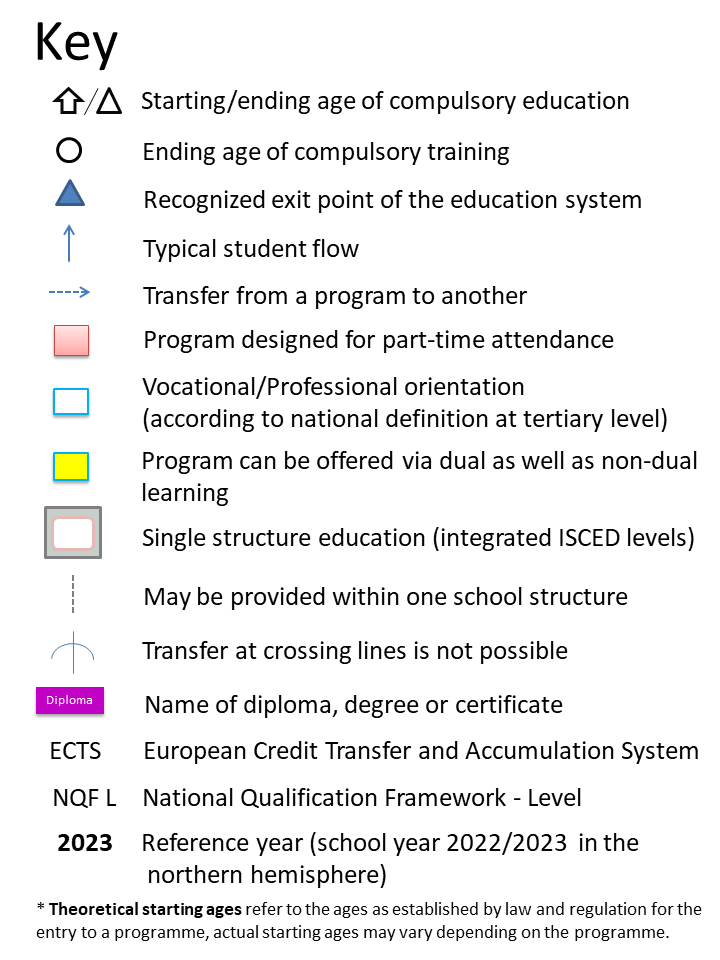
Click on the diagram to get a PDF version