France
Explore the OECD's reports or draw from a wide variety of education indicators and data to construct your own, customised country reports, highlighting the facts, developments and outcomes of your choice.


France
Teachers and teaching conditions (TALIS 2024)
  • In France, teachers are on average 45 years old, which is the same as the OECD average of 45 years. Since 2018, the share of teachers aged 50 and above has increased by 9 percentage points.
  • Half of teachers, 50%, have non-teaching work experience (lower than the OECD average: 57%).
  • Schools where more than 10% of students have a first language different from the language of instruction employ 17% of teachers (lower than the OECD average: 25%). The share of teachers who feel they can adapt their teaching to cultural diversity “quite a bit” or “a lot” is 56% (lower than the OECD average: 63%).
  • Just over half of teachers, 52%, feel they can support students’ social and emotional learning “quite a bit” or “a lot” (lower than the OECD average: 73%).
  • At least one hybrid or online lesson in the last month was reported in schools where 8% of teachers work (lower than the OECD average: 16%).
  • Only 14% of teachers report having used artificial intelligence (AI) in their work (lower than the OECD average: 36%).
  • Among novice teachers (with up to five years of experience), 17% have an assigned mentor (lower than the OECD average: 26%). This share has not changed since 2018.
  • Just over a third of teachers, 35%, report that the professional learning activities they participated in during the previous 12 months had a positive impact on their teaching (lower than the OECD average: 55%).
  • The most frequent forms of collaboration among teachers include: engaging in discussions about the learning development of specific students (43%), exchanging teaching materials (30%), and working with colleagues to ensure common standards in evaluations for assessing student progress (20%).
  • In France, only 4% of teachers “agree” or “strongly agree” that teachers are valued in society (lower than the OECD average: 22%). This share decreased by 3 percentage points since 2018.
  • Just under three out of five teachers, 59%, “agree” or “strongly agree” that they are satisfied with their terms of employment, excluding salaries (lower than the OECD average: 68%). Satisfaction has decreased by 21 percentage points since 2018.
  • Only 27% of teachers “agree” or “strongly agree” that they are satisfied with their salaries (lower than the OECD average: 39%). This share has not changed since 2018.
  • The most commonly reported sources of stress are: keeping up with changing requirements from authorities (62%), having too much administrative work (58%), and modifying lessons for students with special education needs (49%).
  • The share of teachers who report that, all in all, they are satisfied with their jobs is 79% (lower than the OECD average: 89%). Satisfaction has decreased by 5 percentage points since 2018.
  • Among teachers under age 30, 14% express their intention of leaving teaching within the next five years (lower than the OECD average: 20%). This share has increased by 10 percentage points since 2018.

  • * Estimates for Alberta (Canada), the Netherlands, New Zealand and Norway should be interpreted with caution due to higher risk of non-response bias.

    Select first some countries to compare, choose the charts you wish to display and customise them.

    The following list displays indicators for which your selected country shows the highest and lowest values among countries. The list can be sorted by level of education or by age group. All rankings are calculated including available data from OECD and partner countries. Find out more about the methodology here.

    Show indicators for which your country ranks among the top or bottom: Sort by:

    Initial and induction training of teachers

    The proportion of recent lower secondary teacher graduates in France who “agree” or “strongly agree” that the quality of their initial education was high overall was among the lowest across countries with available data. (52.7 %, rank 55/55 , 2024) Download Indicator

    The proportion of recent lower secondary teacher graduates in France who reported that their initial education prepared them well for teaching in a multicultural or multilingual setting was among the lowest across countries with available data. (14.5 %, rank 54/55 , 2024) Download Indicator

    The share of recent lower secondary teacher graduates in France reporting that their initial education prepared them well to support students’ social and emotional development was among the smallest across countries with available data. (13.1 %, rank 55/55 , 2024) Download Indicator

    The percentage of recently appointed lower secondary teachers in France who reported taking part in either formal or informal induction in their school was among the lowest across countries with available data. (56.5 %, rank 52/55 , 2024) Download Indicator

    Professional development of teachers

    A small percentage of teachers feel professional development activities in the 12 months prior to the survey had a positive impact on their teaching practices. (35.3 %, rank 51/55 , 2024) Download Indicator

    Among novice lower secondary teachers in France, the percentage reporting that professional learning activities during the 12 months preceding the survey had a positive impact on their teaching was among the lowest across countries with available data. (38.1 %, rank 53/55 , 2024) Download Indicator

    Teacher appraisal and feedback

    Compared to other countries participating in TALIS, in France, there is a high proportion of eachers who report receiving feedback from external individuals or bodies. (90.6 %, rank 3/55 , 2024) Download Indicator

    Teachers' practices

    The proportion of lower secondary teachers in France who feel confident supporting students’ social and emotional learning “quite a bit” or “a lot” was among the lowest across countries with available data. (51.8 %, rank 54/55 , 2024) Download Indicator

    ICT for teaching

    In France, the share of lower secondary teachers reporting that they have used artificial intelligence (AI) in their work was among the smallest across countries with available data. (13.5 %, rank 55/55 , 2024) Download Indicator

    Teaching students with special needs

    A higher proportion of teachers in France teach in classes with more than 10% of special needs students compared to other TALIS countries. (74.3 %, rank 3/55 , 2024) Download Indicator

    Teacher leadership and autonomy

    The percentage of lower secondary teachers in France who “agree” or “strongly agree” that their school encourages staff to lead new initiatives was among the lowest across countries with available data. (75.5 %, rank 51/55 , 2024) Download Indicator

    In France, the share of lower secondary teachers reporting substantial or full autonomy in curriculum implementation while working in schools where they are appraised at least once per year was among the smallest compared to other countries. (39.3 %, rank 55/55 , 2024) Download Indicator

    The proportion of lower secondary teachers in France who reported substantial or full autonomy in selecting teaching methods and strategies, and who work in schools with at least annual appraisals, was among the lowest across participating countries. (38.5 %, rank 55/55 , 2024) Download Indicator

    Teachers' autonomy, collegiality and collaboration

    Compared to most other TALIS countries, France has a lower proportion of teachers who participate in collaborative professional learning in their school at least once a month. (3.2 %, rank 55/55 , 2024) Download Indicator

    The average weekly time that full-time lower secondary teachers in France reported spending on teamwork and dialogue with colleagues within their school was among the lowest across countries with available data. (2 Hours/week, rank 53/55 , 2024) Download Indicator

    The percentage of lower secondary teachers in France who reported working with colleagues to ensure common standards in evaluations for assessing student progress at least once a month was among the lowest across countries with available data. (19.6 %, rank 54/55 , 2024) Download Indicator

    In France, the share of lower secondary teachers who “agree” or “strongly agree” that their principal has good professional relationships with staff was among the smallest compared to other countries. (79.3 %, rank 53/55 , 2024) Download Indicator

    Teachers' satisfaction with their jobs

    A smaller proportion of teachers believe that the teaching profession is valued in society. (3.8 %, rank 55/55 , 2024) Download Indicator

    A smaller proportion of teachers are satisfied with their job relative to most other TALIS countries. (79.2 %, rank 54/55 , 2024) Download Indicator

    Status of the teaching profession

    The share of lower secondary teachers in France who “agree” or “strongly agree” that teachers are valued by parents and guardians was among the smallest across countries with available data. (44.6 %, rank 55/55 , 2024) Download Indicator

    The percentage of lower secondary teachers in France who 'agree' or 'strongly agree' that their views are valued by policymakers was among the lowest across countries with available data. (4.4 %, rank 54/55 , 2024) Download Indicator

    Teachers’ working conditions, mobility and risk of attrition

    France has one of the highest proportion of teachers employed on a permanent contract. (93.7 %, rank 3/55 , 2024) Download Indicator

    The average time spent on administrative work by full-time lower secondary teachers in France was among the shortest across countries with available data. (1.5 Hours/week, rank 51/55 , 2024) Download Indicator

    The percentage of lower secondary teachers in France who "agree" or "strongly agree" that they are asked to implement change initiatives without the necessary resources was among the highest across countries with available data. (49.2 %, rank 1/55 , 2024) Download Indicator

    Teacher stress factors

    In France, the share of lower secondary teachers reporting stress from modifying lessons for students with special education needs was among the highest across countries with available data. (49.1 %, rank 5/55 , 2024) Download Indicator


    The data table will display up to six selected countries.
    General findings
    
                            
    • Teachers are aging in many education systems. While the average age of teachers is around 45 years old, more than one out of two teachers are 50 or older.
    • Prior non-teaching work experience is more and more common for teachers. In around half of the education systems, at least one out of two teachers have prior non-teaching work experience.
    Visualisations
    Click the arrow sign next to the title: arrows to display other variables
    Click the arrow sign next to the title: arrows to display other variables
    Click the arrow sign next to the title: arrows to display other variables
    
                            
    • Around one in three teachers report having used artificial intelligence (AI) in their work, on average across OECD education systems.
    • Many teachers – especially female and experienced teachers – report meeting key lesson aims, though supporting students' social and emotional learning remains challenging.
    Visualisations
    Click the arrow sign next to the title: arrows to display other variables
    Click the arrow sign next to the title: arrows to display other variables
    Click the arrow sign next to the title: arrows to display other variables
    
                            
    • The large majority of teachers are satisfied with their profession, which indicates that most teachers find meaning and personal fulfilment in their work. Almost nine in ten teachers report that they are satisfied with their jobs overall.
    • Administrative workload remains a considerable demand for teachers. About half of teachers report excessive administrative work as a source of work-related stress, particularly those with more than ten years of experience.
    • Discipline and behaviour issues as sources of stress are important predictors of teachers’ fulfilment of their lesson aims, their well-being, job satisfaction and their intention to leave teaching. About one in five teachers report experiencing significant disruptive noise and disorder in their classrooms, and the share of time spent on maintaining discipline has increased since 2018.
    • Teachers are spending more time working together compared to 2018. Full-time teachers report spending around 3 hours per week participating in teamwork and dialogue with colleagues. Teachers who report good professional relationships with principals, other teachers, parents and guardians, and students tend to report higher well-being and job satisfaction.
    Visualisations
    Click the arrow sign next to the title: arrows to display other variables
    Click the arrow sign next to the title: arrows to display other variables
    Click the arrow sign next to the title: arrows to display other variables
    
                            
    • Administrative workload remains a considerable demand for teachers. About half of teachers report excessive administrative work as a source of work-related stress, particularly those with more than ten years of experience.
    • Discipline and behaviour issues as sources of stress are important predictors of teachers’ fulfilment of their lesson aims, their well-being, job satisfaction and their intention to leave teaching. About one in five teachers report experiencing significant disruptive noise and disorder in their classrooms, and the share of time spent on maintaining discipline has increased since 2018.
    • Teachers’ satisfaction with their terms of employment (including salary) has increased in many education systems since 2018.
    Visualisations
    Click the arrow sign next to the title: arrows to display other variables
    Click the arrow sign next to the title: arrows to display other variables
    Click the arrow sign next to the title: arrows to display other variables
    
                            
    • Mentoring is gaining popularity. About one in four novice teachers (teachers with up to five years of teaching experience) has an assigned mentor.
    • While nearly all teachers participate in continuous professional learning, not all of them find that doing so has a positive impact on their teaching. Just 55% of teachers report that the professional learning activities they participated in during the 12 months preceding the survey had a positive impact on their teaching.
    Visualisations
    Click the arrow sign next to the title: arrows to display other variables
    Click the arrow sign next to the title: arrows to display other variables
    Click the arrow sign next to the title: arrows to display other variables
    
                            
    • Teachers are spending more time working together compared to 2018. Full-time teachers report spending around 3 hours per week participating in teamwork and dialogue with colleagues. Teachers who report good professional relationships with principals, other teachers, parents and guardians, and students tend to report higher well-being and job satisfaction.
    Visualisations
    Click the arrow sign next to the title: arrows to display other variables
    Click the arrow sign next to the title: arrows to display other variables
    Click the arrow sign next to the title: arrows to display other variables
    
                            
    • Feedback and appraisal are common features of teachers’ professional lives. On average across OECD education systems, 88% of teachers report receiving feedback from their school principal, 61% from assigned mentors and 55% from external individuals or bodies. At the same time, principals report that only less than 6% of teachers are never formally appraised.
    Visualisations
    Click the arrow sign next to the title: arrows to display other variables
    Click the arrow sign next to the title: arrows to display other variables
    Click the arrow sign next to the title: arrows to display other variables
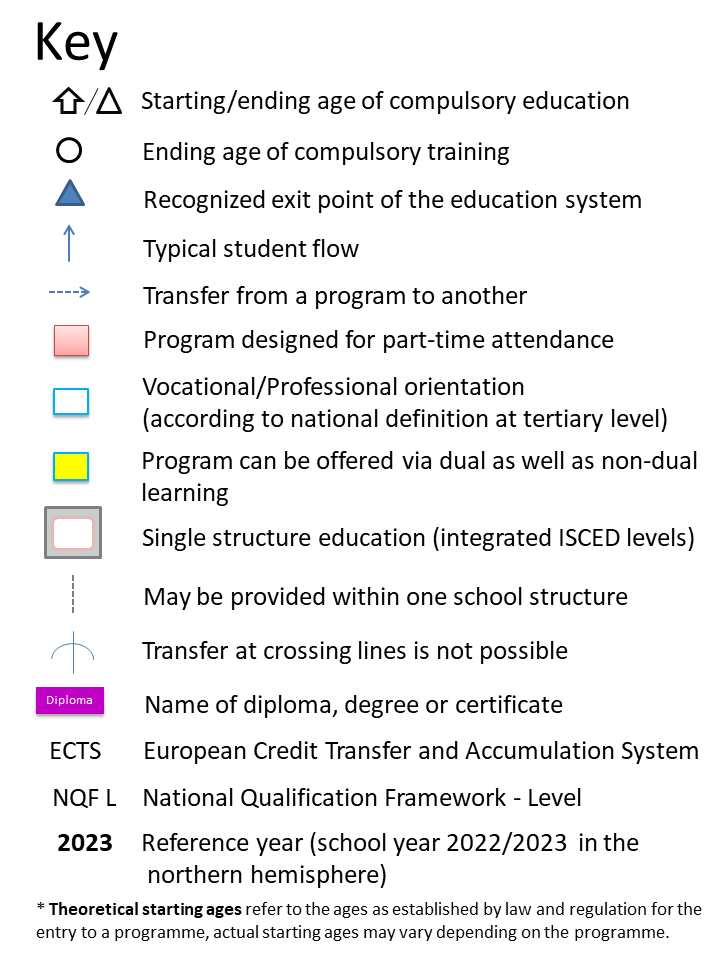
    Key
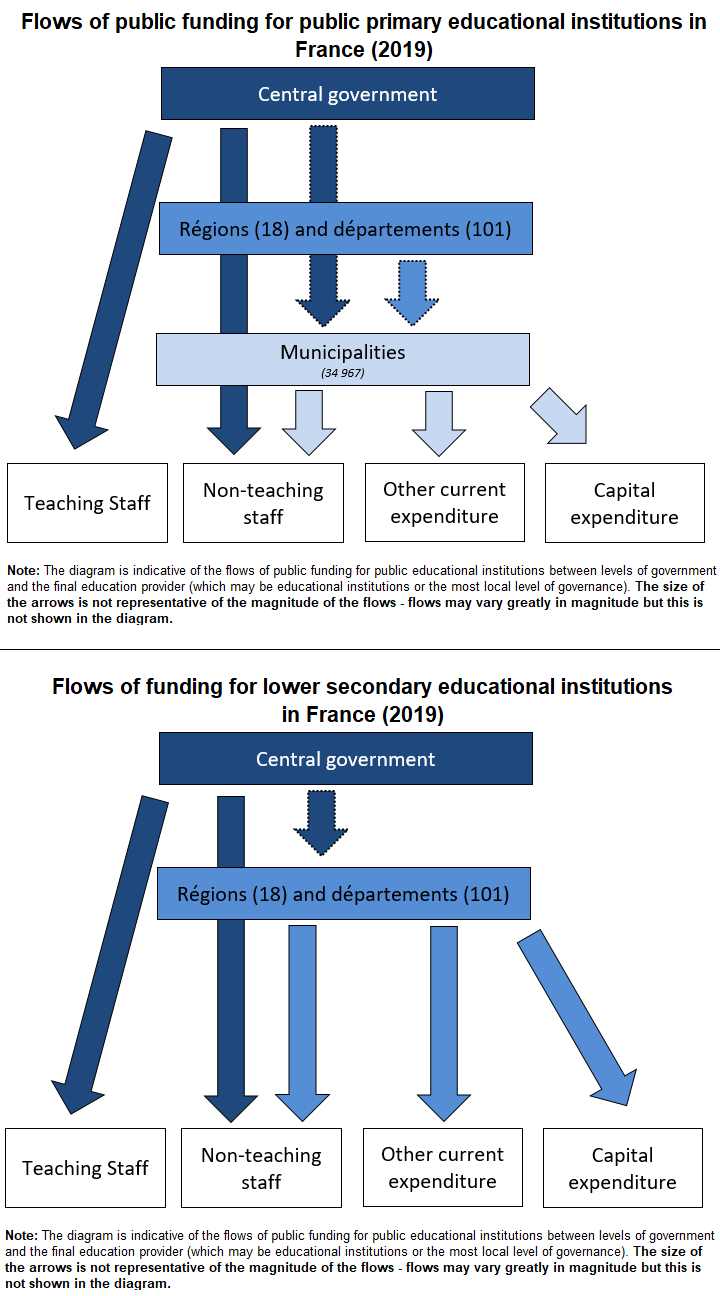
    Diagram of funding flows - France

    Click on the coverpage to see the full OECD iLibrary version
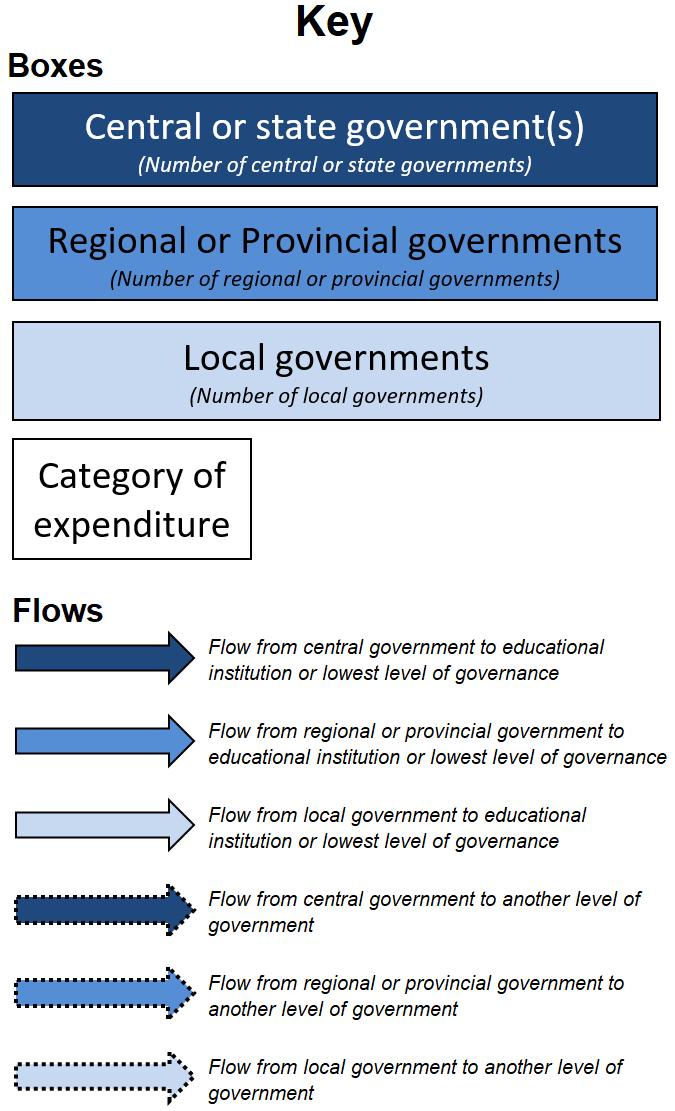
    Key
    Country Reviews for France

    Note: These values should be interpreted with care since they are influenced by countries' specific contexts and trade-offs. In education, there is often no simple most- or least-efficient model. For instance, the share of private expenditure in education must be read against other measures designed to mitigate inequities, such as loans and grants; longer learning time is an opportunity to convey more and better content to students, but may hinder investments in other important areas. If you want further information on the nature of different variables, please take the time to read the analysis and contextual information, available at the website for each publication.
    All rankings for individual variables are compiled on the basis of OECD and G20 countries for which data are available. The OECD average includes only OECD countries which are listed here: https://www.oecd.org/en/about/members-partners.html

    Reference years displayed in the Education GPS correspond to the most common year of reference among countries for which data is available on each variable. Data for the latest available year is preferred and some countries may have provided data refering to a more recent or late year. To know more about possible exceptions on data please click on the "Download Indicator" link on each variable. When a year of reference corresponds to a school year encompassing two years, the reference reads as follows: 2026 for school year 2025/2026.

    *TALIS averages are based on all countries participating in the TALIS survey, including partner countries and economies. This explains the difference between the OECD average and the TALIS averages. Data from the TALIS survey and Education at a Glance (EAG) may differ. See Annex E of the TALIS technical report and Annex 3 of EAG 2024 for more details about the data collections.

    For additional notes, please refer to annexes in the list of links below the introductory country profile text.