China

Country overview

Select a country to explore its education data and publications.


China
Overview of the education system (EAG 2026)
  • In 2023, China allocated an average of 10.5% of total government expenditure to education from primary to tertiary levels (OECD average : 9.8%), equivalent to 3.4% of GDP (OECD average : 4.2%).
  • Total expenditure on educational institutions per full-time equivalent student equalled 7710 equivalent USD for tertiary education in China (OECD average : 22402 equivalent USD), while it added up to 4229 equivalent USD for primary education (OECD average : 13552 equivalent USD).
  • Select first some countries to compare, choose the charts you wish to display and customise them.

    The following list displays indicators for which your selected country shows the highest and lowest values among countries. The list can be sorted by level of education or by age group. All rankings are calculated including available data from OECD and partner countries. Find out more about the methodology here.

    Show indicators for which your country ranks among the top or bottom: Sort by:

    Participation in education

    The percentage of three-year-olds in early childhood education in China is one of the lowest among OECD and partner countries with available data. (0 %, rank 42/44 , 2024) Download Indicator

    The percentage of five-year-olds in ECEC in China is one of the lowest among OECD and partner countries with available data. (0 %, rank 41/44 , 2024) Download Indicator

    Student mobility

    The share of worldwide foreign and international students is one of the largest among OECD and partner countries with available data. (3.6 %, rank 9/46 , 2023) Download Indicator

    Expenditure per student

    Annual expenditure per tertiary student is one of the lowest among OECD and partner countries with available data. (7710 USD Equivalent, rank 36/38 , 2023) Download Indicator

    Annual expenditure per student from primary to tertiary level is one of the lowest among OECD and partner countries with available data. (5626 USD Equivalent, rank 36/37 , 2023) Download Indicator

    Annual expenditure per primary student is one of the lowest among OECD and partner countries with available data. (4229 USD Equivalent, rank 35/37 , 2023) Download Indicator

    Annual expenditure per secondary student is one of the lowest among OECD and partner countries with available data. (5901 USD Equivalent, rank 35/37 , 2023) Download Indicator

    In China, the annual expenditure on educational institutions per full-time equivalent student in primary, secondary and post-secondary non-tertiary education, is relatively low. (5019 USD Equivalent, rank 36/37 , 2023) Download Indicator

    Annual expenditure per full-time equivalent student in primary to tertiary education is one the lowest among OECD and partner countries with available data. (4814 USD Equivalent, rank 36/37 , 2023) Download Indicator

    In China, public expenditure from initial source of funds on primary, secondary and post-secondary non-tertiary education per student is relatively low. (4843 USD Equivalent, rank 38/42 , 2023) Download Indicator

    China has a total expenditure on educational institutions per full-time equivalent student (primary, secondary and post-secondary non-tertiary education) comparatively low. (4294 USD Equivalent, rank 35/37 , 2023) Download Indicator

    In China, the public expenditure on public educational institutions per full-time equivalent student from primary to tertiary education is relatively low among OECD and partner countries. (4922 USD Equivalent, rank 39/42 , 2023) Download Indicator

    From 2012 to 2018, the average annual growth in total expenditure on primary to tertiary education in China is one of the smallest among OECD and partner countries with available data. (5211 USD Equivalent, rank 38/41 , 2023) Download Indicator

    In China, the total annual expenditure per full-time equivalent student on tertiary education is one of the smallest among OECD and partner countries with available data. (6597 USD Equivalent, rank 36/38 , 2023) Download Indicator

    Expenditure in education and national wealth

    In China, private expenditure on educational institutions as a percentage of GDP on primary to tertiary education from final source of funds is relatively high. (0.9 %, rank 10/36 , 2023) Download Indicator

    Government and private expenditure in education

    The share of private expenditure on tertiary education is one of the largest among OECD and partner countries with available data. (41.9 %, rank 8/36 , 2023) Download Indicator

    China has one of the largest shares of private expenditure on primary through tertiary educational institutions among OECD countries and partner economies with available data. (21.7 %, rank 7/36 , 2023) Download Indicator

    In China, the share of public expenditure on educational institutions, for primary to tertiary education is comparatively small. (78.3 %, rank 29/36 , 2023) Download Indicator


    The data table will display up to six selected countries.
    General findings
    
                            
    • Educational attainment remains at an all-time high in 2025 as more people obtain advanced qualifications. Across the OECD, 43% of working-age adults have a tertiary qualification, while the share of adults with upper secondary or post-secondary non-tertiary attainment is slightly lower at 39%.
    • On a similar note, the share of young adults without upper secondary attainment continues to decline across the OECD, standing at 12% in 2025. Therefore, while more young adults obtain a tertiary qualification, the share of individuals whose highest qualification is upper secondary with a vocational orientation is decreasing in almost all OECD countries.
    • Regarding the share of young people being neither in employment nor in education or training, it stood at 14% as of 2025 across OECD countries. However, cross-country comparisons reveal a wide variety of trends, ranging from large falls in Croatia or Ireland to increases in Germany or Latvia.
    Visualisations
    Click the arrow sign next to the title: arrows to display other variables
    Click the arrow sign next to the title: arrows to display other variables
    Click the arrow sign next to the title: arrows to display other variables
    
                            
    • Most children aged 3 to 5 are enrolled in early childhood education, with an average participation rate of 86% across the OECD in 2024. Participation in early childhood education increases with age and tends to be higher in countries with stronger institutional support for participation.
    • 76.2% of students complete upper secondary programmes within the theoretical programme duration. This rises to 84.9% with two additional years on average across the OECD.
    Visualisations
    Click the arrow sign next to the title: arrows to display other variables
    Click the arrow sign next to the title: arrows to display other variables
    Click the arrow sign next to the title: arrows to display other variables
    
                            
    • In 2023, OECD countries allocated an average of 9.8% of total government expenditure to education, equivalent to 4.2% of GDP.
    • Total expenditure on education tends to rise with the level of education. In primary education, expenditure per student was USD 13 552 in 2023 on average across the OECD. This amount rises to USD 14 923 in secondary education and to USD 22 402 in tertiary education.
    • Tertiary education continues to expand, placing pressure on public budgets. Private sources represent a larger share of total funding at the tertiary level than at any other level of education. However, as a whole most investment in education comes from public sources. On average, across the OECD, government expenditure on primary to tertiary education corresponded to 4% of GDP in 2023, while private expenditure corresponded to 0.6%. Both of these figures are measured as initial source of funds, which implies that we are tracking the original provider.
    • Research and development represents around one-third of total expenditure across the OECD on tertiary educational institutions, underlining their dual role in both teaching and research. On average across the OECD, in 2023, USD 8 060 were invested annually into research and development for every student enrolled in tertiary education.
    Visualisations
    Click the arrow sign next to the title: arrows to display other variables
    Click the arrow sign next to the title: arrows to display other variables
    Click the arrow sign next to the title: arrows to display other variables
    
                            
    • Compulsory teaching time averages 770 hours per year for primary students and 710 hours for lower secondary students (general programmes), a difference of about 60 hours annually.
    • The ratio of children to teachers in primary education has slightly fallen across most OECD countries, decreasing from an average of 15 children per teacher in 2015 to 14 in 2024.
    • Teachers’ statutory salaries increase with the level of education taught. On average, across OECD countries and economies, the salaries of teachers with the most prevalent qualifications with 15 years of experience range from USD 60 437 at pre-primary level to USD 68 928 at upper secondary level.
    • Teachers’ actual salaries at primary and general secondary levels of education are 87-95% of the average earnings of tertiary-educated workers across OECD countries. School heads' actual salaries are usually higher than those of tertiary-educated workers.
    Visualisations
    Click the arrow sign next to the title: arrows to display other variables
    Click the arrow sign next to the title: arrows to display other variables
    Click the arrow sign next to the title: arrows to display other variables
    
                            
    • On average across OECD countries, 9.1% of teachers in primary and secondary education are non-fully qualified, with shares exceeding 18% in Chile, Denmark, Estonia and Germany.
    • Furthermore, the share of fully qualified teachers leaving the profession in primary and secondary schools stands at 6.4% of the total teaching workforce.
    • The ratio of children to teachers in primary education has slightly fallen across most OECD countries, decreasing from an average of 15 children per teacher in 2015 to 14 in 2024.
    • Regarding job satisfaction among teachers, participating countries show wide differences. Japan, Spain and Czechia reported that teachers tend to be much more satisfied with their jobs than other employed adults. On the other hand, teachers in Hungary, Chile or Latvia tend to be less satisfied with their jobs than other employed adults.
    Visualisations
    Click the arrow sign next to the title: arrows to display other variables
    Click the arrow sign next to the title: arrows to display other variables
    Click the arrow sign next to the title: arrows to display other variables
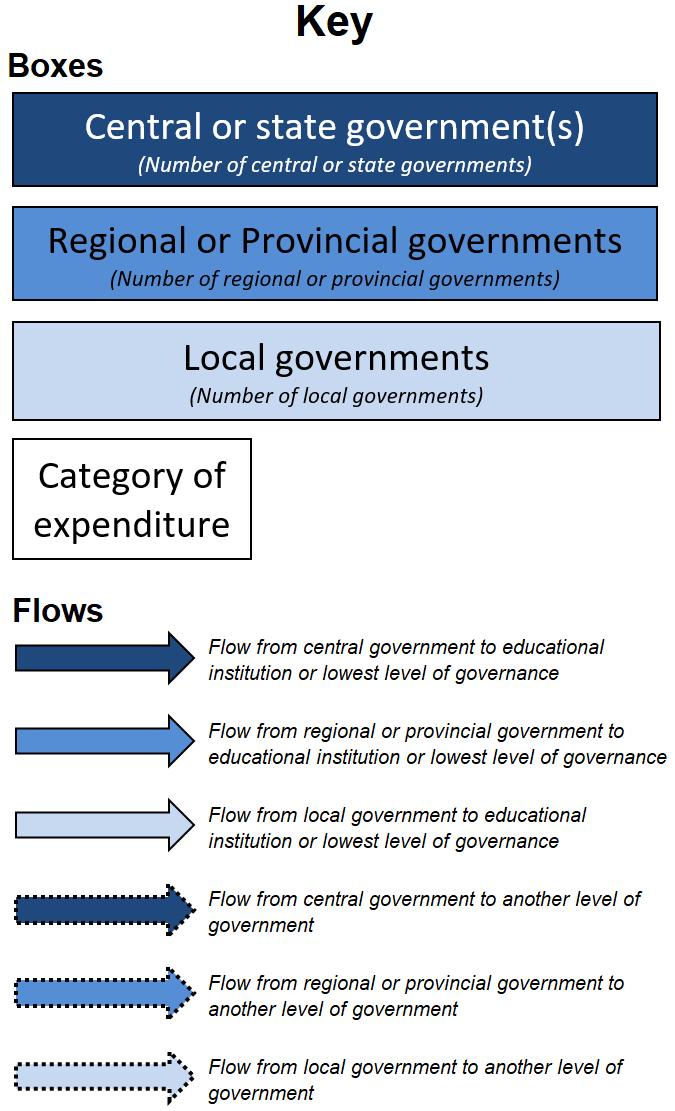
    Key
    Diagram of funding flows - China

    Click on the coverpage to see the full OECD iLibrary version
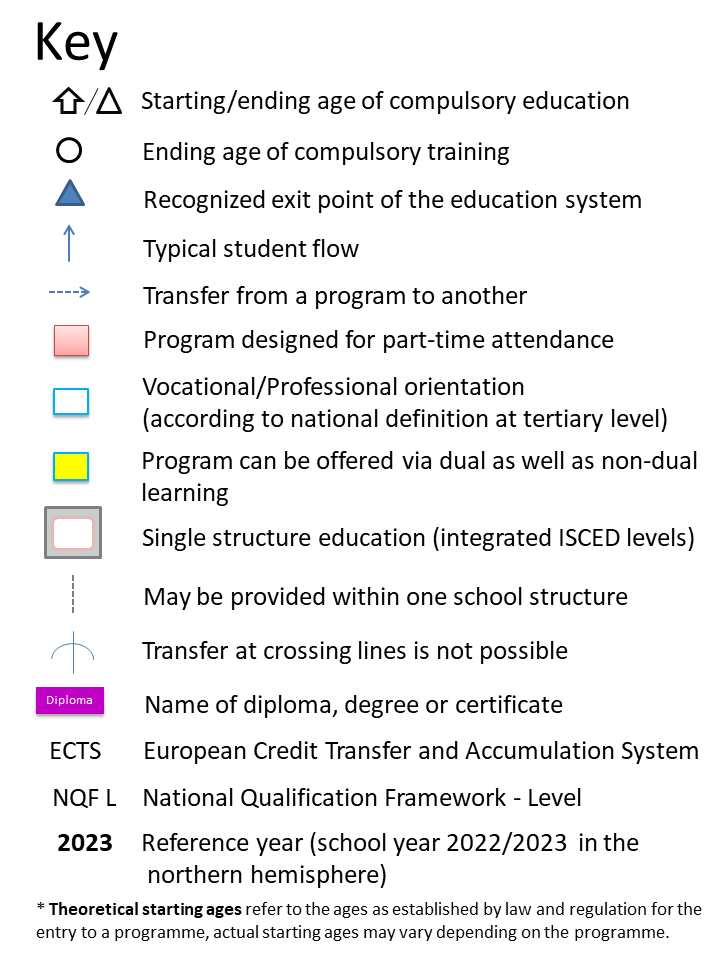
    Key
    Country Reviews for China

    Note: These values should be interpreted with care since they are influenced by countries' specific contexts and trade-offs. In education, there is often no simple most- or least-efficient model. For instance, the share of private expenditure in education must be read against other measures designed to mitigate inequities, such as loans and grants; longer learning time is an opportunity to convey more and better content to students, but may hinder investments in other important areas. If you want further information on the nature of different variables, please take the time to read the analysis and contextual information, available at the website for each publication.
    All rankings for individual variables are compiled on the basis of OECD and G20 countries for which data are available. The OECD average includes only OECD countries which are listed here: https://www.oecd.org/en/about/members-partners.html

    Reference years displayed in the Education GPS correspond to the most common year of reference among countries for which data is available on each variable. Data for the latest available year is preferred and some countries may have provided data refering to a more recent or late year. However, OECD averages from Education at a Glance coming from the OECD database are the averages for the indicator reference year appearing in the Education GPS and may differ from averages in the book where averages can include data from multiple reference years, based on countries' data availability.

    To know more about possible exceptions on data please click on the "Download Indicator" link on each variable. When a year of reference corresponds to a school year encompassing two years, the reference reads as follows: 2026 for school year 2025/2026 in the Northern Hemisphere.

    *TALIS averages are based on all countries participating in the TALIS survey, including partner countries and economies. This explains the difference between the OECD average and the TALIS averages. Data from the TALIS survey and Education at a Glance (EAG) may differ. See Annex E of the TALIS technical report and Sources Methodologies and Technical Notes of EAG 2025 for more details about the data collections.

    For additional notes, please refer to annexes in the list of links below the introductory country profile text.