Australia
Country overview



Country overview
Select a country to explore its education data and publications.
Explore education indicators through the available country profiles.
Read the latest OECD country notes, reviews and analysis.

Select first some countries to compare, choose the charts you wish to display and customise them.
The mean score in science performance is one of the highest among PISA-participating countries and economies. (509 PISA Score points, rank 10/90 , 2025) Download Indicator
Boys' performance in science is one of the highest among PISA-participating countries and economies. (509 PISA Score points, rank 10/90 , 2025) Download Indicator
Girls' performance in science is one of the highest among PISA-participating countries and economies. (509 PISA Score points, rank 10/90 , 2025) Download Indicator
The percentage of top performers in science (proficiency Level 5 or 6) is one of the highest among PISA-participating countries and economies. (12 %, rank 10/90 , 2025) Download Indicator
The percentage of top-performing boys in science (proficiency Level 5 or 6) is one of the highest among PISA-participating countries and economies. (13.1 %, rank 10/90 , 2025) Download Indicator
The percentage of top-performing girls in science (proficiency Level 5 or 6) is one of the highest among PISA-participating countries and economies. (10.8 %, rank 9/90 , 2025) Download Indicator
Girls' performance in reading is one of the highest among PISA-participating countries and economies. (507 PISA Score points, rank 10/89 , 2025) Download Indicator
The score difference in reading between the 10% of students with the highest scores and the 10% of students with the lowest scores is one of the largest among PISA-participating countries and economies. (291 PISA Score, rank 8/89 , 2025) Download Indicator
The percentage of top performers in reading (proficiency Level 5 or 6) is one of the highest among PISA-participating countries and economies. (11.2 %, rank 5/89 , 2025) Download Indicator
The percentage of top-performing boys in reading (proficiency Level 5 or 6) is one of the highest among PISA-participating countries and economies. (9.3 %, rank 7/89 , 2025) Download Indicator
The percentage of top-performing girls in reading (proficiency Level 5 or 6) is one of the highest among PISA-participating countries and economies. (13 %, rank 5/89 , 2025) Download Indicator
The percentage of top performers in all subjects (mathematics, reading and science) is one of the highest among PISA-participating countries and economies. (4.7 %, rank 10/87 , 2025) Download Indicator
The mean score in computational problem-solving performance is one of the highest among PISA-participating countries and economies. (532 PISA Score points, rank 9/84 , 2025) Download Indicator
In Australia, the share of students in schools whose principal reported banning cell phones and applying subject-specific guidelines was among the largest across countries with available data. (75.7 %, rank 7/89 , 2025) Download Indicator
The share of students who agreed or strongly agreed that they believe their peers like them was among the largest in Australia compared with other countries with available data. (87.3 %, rank 10/88 , 2025) Download Indicator
The share of students reporting that students get distracted by using digital resources in most or every school science lesson was among the largest in Australia compared with other countries with available data. (38.8 %, rank 7/83 , 2025) Download Indicator
Students in Australia spent among the longest amounts of time on digital devices per day for learning activities at school across countries with available data. (3 Hours, rank 1/88 , 2025) Download Indicator
The science performance of students spending between 2 and 3 hours per day using digital devices for learning activities at school was among the highest in Australia compared with other countries with available data, after accounting for student socio-economic status. (541 PISA Score, rank 8/86 , 2025) Download Indicator
In Australia, the science performance of students spending more than 7 hours per day using digital devices for learning activities at school was among the highest across countries with available data, after accounting for student socio-economic status. (520 PISA Score, rank 10/86 , 2025) Download Indicator
Australia has one of the smallest shares of students participating in environment-related activities. (-0.24 PISA Index, rank 84/88 , 2025) Download Indicator
The percentage of students reporting their participation to at least one environmental-related activity is relatively low in Australia. (61.7 %, rank 84/88 , 2025) Download Indicator
The mean science performance of students reporting almost daily use of AI to help them learn and being tasked in school lessons to assess the quality of AI-generated information was among the highest in Australia compared with other countries with available data. (528 PISA Score, rank 10/83 , 2025) Download Indicator
In Australia, the difference in the index of students' AI use for schoolwork between advantaged and disadvantaged schools was among the widest across countries with available data. (0.66 PISA Index, rank 1/63 , 2025) Download Indicator
In Australia, a small share of students attend schools whose principal reported that the school's capacity to provide instruction is hindered to some extent or a lot by a lack of educational material. (8.6 %, rank 79/88 , 2025) Download Indicator
 to display other variables
to display other variables
to display other variables
to display other variables
to display other variables
to display other variables
to display other variables
to display other variables
to display other variables
to display other variables
to display other variables
to display other variables
to display other variables
to display other variables
to display other variables
to display other variables
to display other variables
to display other variables
to display other variables
to display other variables
to display other variables
to display other variables
to display other variables
to display other variables
to display other variables
to display other variables
to display other variables
to display other variables
to display other variables
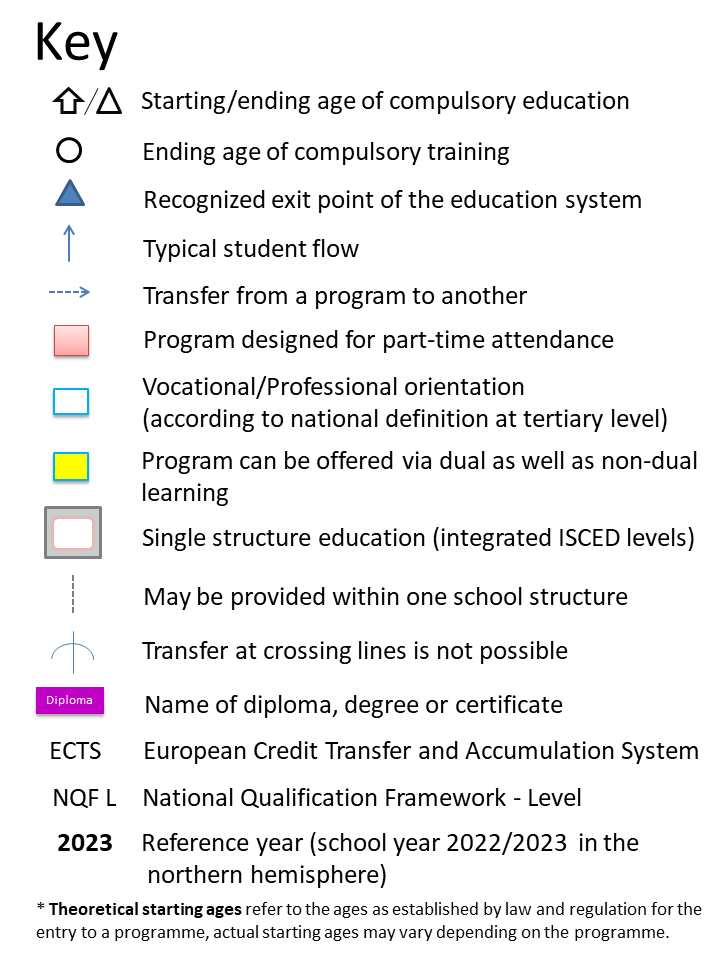
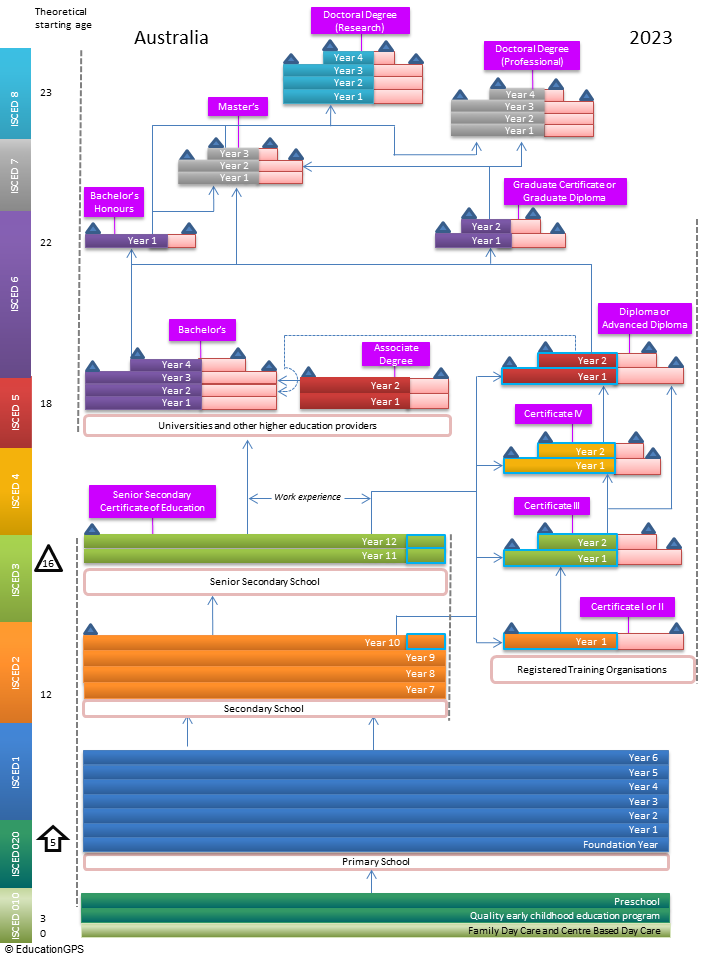
Click on the diagram to get a PDF version