


 Slovenia
Slovenia
Slovenia
 Interactive data profiles:
 |
|
|
|
|
|
|
|
|
|
|
|
|
|
|
|
|
|
|
|
|
|
|
|
|
|
|
|
|
|
|
|
|
|
|
|
|
|
|
|
|
|
|
|
|
|
|
|
|
|
|
|
|
|
|
|
|
|
|
|
|
|
|
|
|
|
|
|
|
|
|
|
|
|
|
|
|
|
|
|
|
|
|
|
|
|
|
|
|
|
|
|
|
|
|
|
|
|
|
|
|
|
|
|
|
|
|
|
|
|
|
|
|
|
|
|
|
|
|
|
|
|
|
|
|
|
|
|
|
|
|
|
|
|
|
|
|
|
|
|
|
|
|
|
|
|
|
|
|
|
|
|
|
|
|
|
|
|
|
|
|
|
|
|
|
|
|
|
|
|
|
|
|
|
|
|
|
|
|
|
|
|
|
|
|
|
|
|
|
|
|
|
|
|
|
|
|
|
|
|
|
|
|
|
|
|
|
|
|
|
|
|
|
|
|
|
|
|
|
|
|
|
|
|
|
|
|
|
|
|
|
|
|
|
|
|
|
|
|
|
|
|
|
|
|
|
|
|
|
|
|
|
|
|
|
|
|
|
|
|
|
|
|
|
|
|
|
|
|
|
|
|
|
|
|
|
|
|
|
|
|
|
|
|
|
|
|
|
|
|
|
|
|
|
|
|
|
|
|
|
|
|
|
|
|
|
|
|
|
|
|
|
|
|
|
|
|
|
|
|
|
|
|
|
|
|
|
|
|
|
|
|
|
|
|
|
|
|
|
|
|
|
|
|
|
|
|
|
|
|
|
|
|
|
|
|
|
|
|
|
|
|
|
|
|
|
|
|
|
|
|
|
|
|
|
|
|
|
|
|
|
|
|
|
|
|
|
|
|
|
|
|
|
|
|
|
|
|
|
|
|
|
|
|
|
|
|
|
|
|
|
|
|
|
|
|
|
|
|
|
|
|
|
|
|
|
|
|
|
|
|
|
|
|
|
|
|
|
|
|
|
|
|
|
|
|
|
|
|
|
|
|
|
|
|
|
|
|
|
|
|
|
|
|
|
|
|
|
|
|
|
|
|
|
|
|
|
|
|
|
|
|
|
|
|
|
|
|
|
|
|
|
|
|
|
 Country reports and publications
Slovenia
Overview of the education system (EAG 2025)
| Education at a Glance 2025 | Country note | Annexes from Education at a Glance 2025 | OECD Handbook for Internationally Comparative Education Statistics 2018 | Ministrstvo za izobrazevanje, znanost in sport (Ministry of Education, Science, Culture and Sport) | Statisticni urad (Statistical Office) | OECD Education Policy Outlook: Slovenia |

Select first some countries to compare, choose the charts you wish to display and customise them.
The following list displays indicators for which your selected country shows the highest and lowest values among countries.
The list can be sorted by level of education or by age group. All rankings are calculated including available data from OECD
and partner countries.
Find out more about the methodology here.
Show indicators for which your country ranks among the top or bottom:
Sort by:
Attainment
The proportion of 25-64 year-olds who have attained a vocational upper secondary or post-secondary qualification is one of the highest among OECD and partner countries with available data. (49.8 %, rank 5/35 , 2024) Download Indicator
The proportion of 25-34 year-olds who have attained a vocational degree at the upper secondary or post-secondary level is one of the highest among OECD and partner countries with available data. (42.6 %, rank 5/35 , 2024) Download Indicator
Attainment by gender
The proportion of 25-64 year-old women who have attained a general degree at the upper secondary or post-secondary level is one of the lowest among OECD and partner countries with available data. (4.6 %, rank 34/37 , 2024) Download Indicator
Slovenia has one of the smallest share of women among 25-34 year-olds with a vocational upper secondary or post-secondary non-tertiary education. (34.6 %, rank 32/35 , 2024) Download Indicator
The share of 25-34 year-old men with vocational upper secondary or post-secondary non-tertiary education in Slovenia is one of the highest among countries with available data. (65.4 %, rank 4/35 , 2024) Download Indicator
Attainment by field of education
The percentage of 25-64 year-olds with tertiary education who studied in the field of business and administration is one of the lowest among OECD countries and partner economies with available data. (12 %, rank 14/16 , 2024) Download Indicator
The percentage of 25-64 year-olds with tertiary education who studied in the field of business, administration and law is one of the lowest among OECD countries and partner economies with available data. (14.7 %, rank 26/28 , 2024) Download Indicator
The percentage of 25-64 year-olds with tertiary education who studied in the field of health and welfare is one of the lowest among OECD countries and partner economies with available data. (3.2 %, rank 28/28 , 2024) Download Indicator
Entrance
In Slovenia, the average age of new entrants in master's long first degree (LFD) programmes is one of the lowest among OECD and partner countries with available data. (19.3 Years, rank 23/26 , 2023) Download Indicator
Entrance by field of education and gender
In Slovenia, the share of female among new entrants in doctoral programmes enrolled in the field of information and communication technologies is relatively small. (15.4 %, rank 34/35 , 2023) Download Indicator
In Slovenia,the share of male among new entrants in doctoral programmes enrolled in the field of engineering, manufacturing and construction is relatively small. (58.7 %, rank 34/37 , 2023) Download Indicator
The share of male students entering master's or equivalent programmes in health and welfare in Slovenia is one of the smallest compared to other OECD countries and partner economies. (18.2 %, rank 34/37 , 2023) Download Indicator
The share of female in short-cycle tertiary programmes in the field of arts and humanities is one of the lowest among OECD countries and partner economies with available data. (41.2 %, rank 26/30 , 2023) Download Indicator
Participation in education
The enrolment rate among 15-19 year-olds in Slovenia is one of the highest among OECD and partner countries with available data. (94.7 %, rank 2/44 , 2023) Download Indicator
The proportion of upper secondary students enrolled in vocational programmes is one of the largest among OECD and partner countries with available data. (69.9 %, rank 3/44 , 2023) Download Indicator
The share of female students in upper secondary general programmes placed Slovenia among the largest across countries. (61.7 %, rank 2/47 , 2023) Download Indicator
In Slovenia, the percentage of students enrolled in private institutions at all early childhood education level is comparatively low. (5.8 %, rank 34/38 , 2023) Download Indicator
In Slovenia, the percentage of students enrolled in private institutions at early childhood educational and development level is comparatively low. (6.6 %, rank 27/28 , 2023) Download Indicator
In Slovenia, the percentage of students enrolled in private institutions at pre-primary level is comparatively low. (5.4 %, rank 41/45 , 2023) Download Indicator
The average age of short-cycle tertiary students enrolled in vocational programmes is comparativele high. (3 %, rank 3/36 , 2022) Download Indicator
The enrolment rate among students aged 15-19 in upper secondary programmes in Slovenia is one of the highest among OECD and partner countries with available data. (80.2 %, rank 2/47 , 2023) Download Indicator
The enrolment rate among students aged 15-19 in upper secondary vocational programmes in Slovenia is one of the highest among OECD and partner countries with available data. (52.5 %, rank 1/41 , 2023) Download Indicator
Graduation
The percentage of first-time graduates in vocational programmes at upper secondary level is one of the highest among OECD and partner countries with available data. (66.6 %, rank 4/36 , 2023) Download Indicator
In Slovenia, the share of first-time graduates in general programmes at upper secondary level is comparatively low. (33.4 %, rank 34/37 , 2023) Download Indicator
The average age of master's or equivalent graduates in Slovenia is among the youngest. (25.3 Years, rank 18/22 , 2023) Download Indicator
Graduation by gender
In Slovenia, the share of female first-time graduates in short-cycle tertiary programmes is one of the smallest among OECD countries and partner economies with available data. (40.4 %, rank 24/27 , 2023) Download Indicator
In Slovenia, the share of female first-time bachelor's graduates is one of the largest among OECD countries and partner economies with available data. (62.3 %, rank 5/33 , 2023) Download Indicator
In Slovenia, the share of female first-time master's graduates is relatively largest, compared to OECD and partner countries with available data. (71.2 %, rank 2/23 , 2023) Download Indicator
Graduation by field of education
The share of tertiary graduates in STEM fields placed Slovenia among the largest internationally. (30 %, rank 4/44 , 2023) Download Indicator
In Slovenia, the proportion of upper secondary and post-secondary non-tertiary vocational graduates in the field of STEM is one of the highest among OECD and partner countries with available data. (5 %, rank 2/36 , 2022) Download Indicator
In Slovenia, the share of short-cycle tertiary vocational graduates in the field of services is relatively high compared to other OECD countries and partner economies with available data. (3 %, rank 4/37 , 2022) Download Indicator
In Slovenia, the proportion of bachelor's, master's and doctoral or equivalent graduates in the field of STEM is one of the highest among OECD and partner countries with available data. (3 %, rank 2/44 , 2022) Download Indicator
In Slovenia, the proportion of bachelor's, master's and doctoral or equivalent graduates in the field of health and welfare is one of the highest among OECD and partner countries with available data. (2 %, rank 2/45 , 2022) Download Indicator
Graduation by field of education and gender
In Slovenia, the share of male tertiary graduates in the field of business, administration and law is one of the lowest among OECD and partner countries with available data. (15.9 %, rank 42/44 , 2023) Download Indicator
The share of male tertiary graduates in the field of science, technology, engineering and mathematics is relatively high in Slovenia. (50 %, rank 3/44 , 2023) Download Indicator
In Slovenia, the share of female graduates in tertiary education in the field of education is one of the largest among OECD countries and partner economies with available data. (87.3 %, rank 5/43 , 2023) Download Indicator
In Slovenia, the share of female graduates in tertiary education in the fields of business, administration and law is one of the largest among OECD countries and partner economies with available data. (66.4 %, rank 3/43 , 2023) Download Indicator
Completion rates
Male completion rates to Social sciences, journalism and information bachelor's programmes three years beyond the theoretical end were among the lowest across countries with available data. (51 %, rank 26/29 , 2023) Download Indicator
In Slovenia, female completion rates in Business, administration and law bachelor's programmes three years after the theoretical duration were among the lowest values internationally. (52.5 %, rank 27/29 , 2023) Download Indicator
Male completion rates in Business, administration and law bachelor's programmes three years after the theoretical end placed Slovenia among the lowest across countries. (33.8 %, rank 29/29 , 2023) Download Indicator
The completion rate of all new entrants to Business, administration and law bachelor's programmes three years beyond the theoretical duration ranked among the lowest internationally. (45.5 %, rank 28/29 , 2023) Download Indicator
The completion rate of female students in STEM bachelor's programmes, measured three years after the theoretical end, placed Slovenia among the lowest internationally. (52.4 %, rank 25/29 , 2023) Download Indicator
In Slovenia, female completion rates in Agriculture, forestry, fisheries and veterinary bachelor's programmes three years after the theoretical duration were among the lowest internationally. (50 %, rank 23/27 , 2023) Download Indicator
Male completion rates in Agriculture, forestry, fisheries and veterinary bachelor's programmes, measured three years after the theoretical end, placed Slovenia among the lowest across countries. (38.8 %, rank 26/27 , 2023) Download Indicator
Completion rates of all new entrants to Agriculture, forestry, fisheries and veterinary bachelor's programmes, measured three years after the theoretical duration, ranked among the lowest internationally. (44.6 %, rank 24/27 , 2023) Download Indicator
Male completion rates in Health and welfare bachelor's programmes, measured three years after the theoretical duration, placed Slovenia among the lowest internationally. (56.7 %, rank 24/28 , 2023) Download Indicator
In Slovenia, female completion rates in Services bachelor's programmes three years after the theoretical duration were among the lowest internationally. (54.4 %, rank 22/26 , 2023) Download Indicator
Male completion rates in Services bachelor's programmes three years after the theoretical end ranked among the lowest across countries with available data. (41.9 %, rank 23/26 , 2023) Download Indicator
The completion rate of all new entrants to Services bachelor's programmes, measured three years after the theoretical end, was among the lowest internationally. (48.9 %, rank 23/26 , 2023) Download Indicator
Dropout rates
For male new entrants, the drop out rate by the end of the theoretical duration of the programme placed Slovenia among the highest across countries. (40.3 %, rank 3/30 , 2020) Download Indicator
The overall drop out rate of new entrants to bachelor's programmes by the end of the theoretical duration ranked Slovenia among the highest internationally. (33.6 %, rank 5/30 , 2020) Download Indicator
Female drop out rates by the end of the theoretical duration plus one year were among the highest across participating countries. (33.6 %, rank 4/30 , 2021) Download Indicator
For male new entrants, drop out rates one year beyond the theoretical duration placed Slovenia among the highest internationally. (47.7 %, rank 2/30 , 2021) Download Indicator
Drop out rates of all new entrants to bachelor's programmes one year beyond the theoretical duration ranked Slovenia among the highest across countries with available data. (40 %, rank 3/30 , 2021) Download Indicator
Male drop out rates to bachelor's programmes, measured three years beyond the theoretical duration, were among the highest internationally. (44.6 %, rank 4/30 , 2023) Download Indicator
Gap year
The share of female students who entered a bachelor's programme and took at least one gap year was among the lowest across countries with available data. (17.5 %, rank 20/23 , 2020) Download Indicator
The share of male students who entered a bachelor's programme and took at least one gap year placed Slovenia among the lowest internationally. (20 %, rank 20/23 , 2020) Download Indicator
For all students who entered a bachelor's programme, the share who took at least one gap year ranked Slovenia among the lowest across countries with available data. (18.7 %, rank 20/23 , 2020) Download Indicator
Fields of education
In Slovenia, the percentage of new entrants to doctoral programmes in the field of agriculture, forestry, fisheries and veterinary is relatively low, compared to other countries with available data. (0.7 %, rank 33/37 , 2023) Download Indicator
In Slovenia, the percentage of new entrants to doctoral programmes in the field of arts and humanities is relatively low, compared to other countries with available data. (4.1 %, rank 36/37 , 2023) Download Indicator
In Slovenia, the percentage of new entrants to doctoral programmes in the field of social sciences, journalism and information is relatively high, compared to other countries with available data. (17.9 %, rank 4/37 , 2023) Download Indicator
Student mobility
In Slovenia, international or foreign students from North America are least represented among all international or foreign students, compared to other OECD and partner countries with available data. (0.3 %, rank 39/41 , 2023) Download Indicator
In Slovenia, international or foreign students from Europe are most represented among all international or foreign students, compared to other OECD and partner countries with available data. (89.1 %, rank 2/40 , 2023) Download Indicator
Expenditure in education and national wealth
In Slovenia, international expenditure on educational institutions as a percentage of GDP on primary, secondary and post-secondary non-tertiary education from final source of funds is relatively high. (0 %, rank 4/32 , 2022) Download Indicator
In Slovenia, international expenditure as a percentage of GDP from initial source of funds on tertiary education is relatively large. (0.1 %, rank 5/35 , 2022) Download Indicator
Who the teachers are
In Slovenia, the share of short-cycle tertiary teachers aged between 30 and 49 is relatively low, compared to other countries with data available. (36.2 %, rank 22/24 , 2023) Download Indicator
In Slovenia, the percentage of teachers aged between 30 and 49 in pre-primary education is one of the highest among OECD and partner countries with available data. (65.7 %, rank 4/34 , 2023) Download Indicator
Teachers' salaries
The salaries of 25-34 year-old general lower-secondary teachers relative to earnings for full-time, full-year similarly educated workers with tertiary education is low in Slovenia. (0.75 Ratio, rank 24/27 , 2023) Download Indicator
The average actual salaries of 25-34 year-old lower-secondary teachers is one of the lowest in Slovenia relatively compared to OECD and partner countries with available data. (35663 USD Equivalent, rank 23/27 , 2022) Download Indicator
Ratio of student to teaching staff
In Slovenia, the number of students per teacher in general upper secondary education is one of the highest among OECD and partner countries with available data. (17.9 Ratio, rank 4/34 , 2023) Download Indicator
In Slovenia, the number of students per teacher in private institutions tertiary education is one of the lowest among countries with available data. (10.9 Ratio, rank 33/34 , 2023) Download Indicator
In Slovenia, the number of students per teacher in independent private institutions tertiary education is one of the lowest among countries with available data. (6.6 Ratio, rank 23/24 , 2023) Download Indicator
In Slovenia, the number of students per teacher in private institutions short-cycle tertiary education is one of the lowest among countries with available data. (11.8 Ratio, rank 14/18 , 2023) Download Indicator
In Slovenia, the number of students per teacher in independent private short-cycle tertiary education is one of the lowest among countries with available data. (9.6 Ratio, rank 8/9 , 2023) Download Indicator
In Slovenia, the number of students per teacher in private bachelor's, master's, doctoral or equivalent programmes is one of the lowest among countries with available data. (10.7 Ratio, rank 28/29 , 2023) Download Indicator
In Slovenia, the number of students per teacher in independent private bachelor's, master's, doctoral or equivalent programmes is one of the lowest among countries with available data. (5.1 Ratio, rank 21/21 , 2023) Download Indicator
Organisation of the education system
In Slovenia, compulsory instruction time for lower secondary students, in hours per year, is one of the shortest among OECD and partner countries with available data. (766 Hours, rank 38/42 , 2024) Download Indicator
Employment and educational attainment
The employment rate among 25-34 year-olds with upper secondary or post-secondary non-tertiary education is compartively high in Slovenia. (87.7 %, rank 1/37 , 2024) Download Indicator
The employment rate among 55-64 year-olds with upper secondary or post-secondary non-tertiary education is compartively low in Slovenia. (53.4 %, rank 34/38 , 2024) Download Indicator
The employment rate among 25-34 year-olds with a vocational upper secondary or post-secondary non-tertiary education is relatively high compared to other OECD and partner countries. (88.6 %, rank 4/34 , 2024) Download Indicator
The employment rate among 25-34 year-olds with a general upper secondary or post-secondary non-tertiary education is relatively high compared to other OECD and partner countries. (82.6 %, rank 3/36 , 2024) Download Indicator
Employment by gender and educational attainment
The employment rate among 55-64 year-old men with upper secondary or post-secondary non-tertiary education is compartively low in Slovenia. (57.4 %, rank 34/38 , 2024) Download Indicator
In Slovenia, the employment rate among 25-34 year-old men with vocational upper secondary or post-secondary non-tertiary education is comparatively high (93.4 %, rank 5/34 , 2024) Download Indicator
Compared to other countries with available data, the employment rate of 25-34 year-old men with general upper secondary or post-secondary non-tertiary education is relatively high in Slovenia. (90.9 %, rank 1/35 , 2024) Download Indicator
Employment by field of education
The employment rate among 25-64 year-olds with tertiary education who studied in the field of arts is high compared to other OECD and partner countries. (87.5 %, rank 5/16 , 2024) Download Indicator
The employment rate among 25-64 year-olds with tertiary education who studied in the field of natural sciences, mathematics and statistics is high compared to other OECD and partner countries. (93.2 %, rank 1/27 , 2024) Download Indicator
The employment rate among 25-64 year-olds with tertiary education who studied in the field of engineering, manufacturing and construction is high compared to other OECD and partner countries. (93.6 %, rank 2/28 , 2024) Download Indicator
Unemployment by gender and educational attainment
The unemployment rate among 25-64 year-old men with tertiary education is comparatively low. (0.9 %, rank 39/39 , 2024) Download Indicator
The unemployment rate among 25-34 year-old men with tertiary education is compartively low in Slovenia. (0.9 %, rank 37/37 , 2024) Download Indicator
The unemployment rate among 25-34 year-old men with upper secondary or post-secondary non-tertiary education is compartively low in Slovenia. (3.1 %, rank 34/36 , 2024) Download Indicator
The unemployment rate among 55-64 year-old men with tertiary education is compartively low in Slovenia. (0.8 %, rank 33/34 , 2024) Download Indicator
In Slovenia, the share of unemployed 25-64 year-old men with general upper secondary or post-secondary non-tertiary education is relatively low, compared to other OECD and partner countries with available data. (2.4 %, rank 30/33 , 2024) Download Indicator
Compared to other countries with available data, the unemployment rate of 25-34 year-old men with general upper secondary or post-secondary non-tertiary education is relatively low in Slovenia. (2.6 %, rank 31/33 , 2024) Download Indicator
Inactivity and educational attainment
The inactivity rate of 25-34 years-old adults with upper secondary or post-secondary non-tertiary education is low in Slovenia. (7.9 %, rank 35/37 , 2024) Download Indicator
In Slovenia, the inactivity rate of 25-34 year-olds with vocational upper secondary or post-secondary non-tertiary education is relatively low. (6.9 %, rank 31/33 , 2024) Download Indicator
Inactivity by gender and educational attainment
In Slovenia, the inactivity rate of 25-34 year-old men with general upper secondary or post-secondary non-tertiary education is relatively low. (6.7 %, rank 32/33 , 2024) Download Indicator
In Slovenia, the inactivity rate of 25-64 year-old men with vocational upper secondary or post-secondary non-tertiary education is relatively high. (15 %, rank 5/35 , 2024) Download Indicator
In Slovenia, the inactivity rate of 25-34 year-old men with upper secondary or post-secondary non-tertiary education is relatively low. (3.9 %, rank 35/36 , 2024) Download Indicator
Earnings and educational attainment
The share of 25-64 year-old workers without an upper secondary education earning at or below half the overall median in Slovenia is one of the lowest among countries with available data. (9 Index, rank 28/29 , 2023) Download Indicator
The share of 25-64 year-old workers with upper secondary or post-secondary non-tertiary education earning at or below half the overall median in Slovenia is one of the lowest among countries with available data. (6 Index, rank 27/29 , 2023) Download Indicator
The share of 25-64 year-old workers with tertiary education earning at or below half the overall median in Slovenia is one of the lowest among countries with available data. (3 Index, rank 26/29 , 2023) Download Indicator
In Slovenia, the distribution of worker earning more than 1.5 times the median but at or below twice the median among those with below upper secondary education is comparatively low . (2 Index, rank 23/27 , 2023) Download Indicator
Earnings, gender and educational attainment
Earnings of women (as a percentage of men's earnings) among full- and part-time 25-64 year-olds with tertiary education are one of the highest among countries with available data. (81.6 %, rank 3/30 , 2023) Download Indicator
Earnings of women (as a percentage of men's earnings) among full- and part-time 25-64 year-olds with upper secondary or post-secondary non-tertiary education are one of the highest among countries with available data. (85 %, rank 2/30 , 2023) Download Indicator
Neither in education nor employed
The share of unemployed youth neither in formal education nor training among 18-24 year-olds in Slovenia is one of the lowest among countries with available data. (8.4 %, rank 34/37 , 2024) Download Indicator
The share of men without an upper secondary education neither in employment nor in education and training (25-29 year-olds) in Slovenia is relatively low (16.6 %, rank 31/32 , 2024) Download Indicator
The share of women with general upper secondary or post-secondary non-tertiary education neither in employment nor in education and training (25-29 year-olds) in Slovenia is relatively low (12.4 %, rank 23/25 , 2024) Download Indicator
The share of men with general upper secondary or post-secondary non-tertiary education neither in employment nor in education and training (25-29 year-olds) in Slovenia is relatively low (2.9 %, rank 24/24 , 2024) Download Indicator
The share of 25-29 year-olds neither in employment nor in education and training with general upper secondary or post-secondary non-tertiary education in Slovenia is relatively low (8.9 %, rank 26/28 , 2024) Download Indicator
The share of men with vocational upper secondary or post-secondary non-tertiary education neither in employment nor in education and training (25-29 year-olds) in Slovenia is relatively low (4.1 %, rank 26/27 , 2024) Download Indicator
The share of 25-29 year-olds neither in employment nor in education and training with vocational upper secondary or post-secondary non-tertiary education in Slovenia is relatively low. (8.3 %, rank 28/30 , 2024) Download Indicator
The share of women with upper secondary or post-secondary non-tertiary education neither in employment nor in education and training (25-29 year-olds) in Slovenia is relatively low. (14.4 %, rank 30/34 , 2024) Download Indicator
The share of men with upper secondary or post-secondary non-tertiary education neither in employment nor in education and training (25-29 year-olds) in Slovenia is relatively low. (3.9 %, rank 34/35 , 2024) Download Indicator
The share of 25-29 year-olds neither in employment nor in education and training with upper secondary or post-secondary non-tertiary in Slovenia is relatively low. (8.4 %, rank 33/36 , 2024) Download Indicator
The share of men with tertiary education neither in employment nor in education and training (25-29 year-olds) in Slovenia is relatively low. (1.1 %, rank 31/31 , 2024) Download Indicator
The share of 25-29 year-olds neither in employment nor in education and training with tertiary education in Slovenia is relatively low. (4.4 %, rank 36/36 , 2024) Download Indicator
The share of women who are unemployed NEET (18-24 year-olds) in Slovenia is relatively low. (1.6 %, rank 34/34 , 2024) Download Indicator
The share of men who are unemployed NEET (15-29 year-olds) in Slovenia is relatively low. (2.2 %, rank 34/37 , 2024) Download Indicator
The share of unemployed NEET (15-29 year-olds) in Slovenia is relatively low. (2.3 %, rank 34/38 , 2024) Download Indicator
The proportion of youth neither employed nor in education or training among 20-24 year-olds in Slovenia is relatively small. (7.8 %, rank 34/37 , 2024) Download Indicator
The share of youth neither employed nor in education or training among 25-29 year-olds in Slovenia is one of the lowest among OECD and partner countries with available data. (7.9 %, rank 38/38 , 2024) Download Indicator
Among 20-24 year-old men in Slovenia, a small share of them are neither employed nor in education or training. (8.7 %, rank 34/37 , 2024) Download Indicator
Among 25-29 year-old men in Slovenia, a small share of them are neither employed nor in education or training. (3.8 %, rank 37/37 , 2024) Download Indicator
In Slovenia, the percentage of women neither employed nor in education or training among 20-24 year-olds is relatively low. (6.7 %, rank 35/37 , 2024) Download Indicator
The proportion of 18-24 year-olds who are neither employed nor in education or training is comparatively small in Slovenia. (8.4 %, rank 34/37 , 2024) Download Indicator
The percentage of 18-24 year-old women neither employed nor in education or training is one of the lowest among OECD countries and partner economies with available data. (7.2 %, rank 35/37 , 2024) Download Indicator
The data table will display up to six selected countries.
General findings
- Tertiary attainment among young adults has reached 48% on average across the OECD, the highest level ever, but progress has slowed since 2021. Attainment remains unequal, with women generally outpacing men, and older generations showing lower rates.
- Employment outcomes for tertiary-educated adults remain strong overall: 87% of them are employed compared to 60% of those without upper seconday. Tertiary education offers good protection against unemployment, but women and disadvantaged groups still face labour market gaps, and inactivity persists among some adults. Moreover, adults with tertiary education earn on average 54% more than those with only upper secondary education.
- Gender pay gaps remain significant. Despite higher attainment, women with tertiary education consistently earn less than men, even when working full-time, and this gap persists across age groups (73% on average for women aged 25 to 64).
- Fields of study strongly influence labour market outcomes. Graduates in engineering and in health and welfare fare particularly well, while women’s participation in STEM remains below parity (14% of graduates at tertiary level) despite being 58% of all tertiary graduates.
- Internationalisation continues to expand in tertiary education. The share of international students has grown steadily, and OECD countries host a large proportion of the world’s mobile students, reinforcing their global role in higher education.
- Sustaining tertiary education requires adequate investment. Spending per student is already at 21 021 USD and rising, and tertiary expenditure represents a notable share of GDP (1.4% on average in OECD), making efficiency and equity crucial for long-term sustainability.
| Education policies: Attainment | Education policies: Access and Participation | Education policies: Finance and Funding | Education policies: Labour market outcomes |
Visualisations
Click the arrow sign next to the title:
 to display other variables
to display other variables
Click the arrow sign next to the title:
to display other variables
to display other variables
Click the arrow sign next to the title:
to display other variables
to display other variables
- Although many countries have near universal upper secondary attainment among 25–34 year-olds, on average across the OECD 13% of younger adults still lack an upper secondary qualification.
- NEET shares are now below pre-pandemic levels in about half of OECD and partner countries with trend data; in 8 of these 16 countries the decline exceeds 1 percentage point, while 17 countries exceed pre-pandemic benchmarks and 6 saw increases of more than 2 percentage points.
- Employment rates rise steadily with higher tertiary attainment: short-cycle 83%, bachelor’s 86%, master’s 90%, and doctoral or equivalent 93% among 25–64 year-olds.
- Earnings premiums also increase with qualification level: on average across the OECD, short-cycle graduates earn 17% more than those with upper secondary; the advantage is 39% for bachelor’s and 83% for master’s/doctoral graduates.
Visualisations
Click the arrow sign next to the title:
to display other variables
to display other variables
Click the arrow sign next to the title:
to display other variables
to display other variables
Click the arrow sign next to the title:
to display other variables
to display other variables
- Most children aged 3 to 5 are enrolled in early childhood education, with an average participation rate of 85% across the OECD. By contrast, only 29% of children under the age of 3 are enrolled.
- Participation in early childhood education has grown over the past decade, with enrolment for children under age 3 increasing by 9 percentage points to 29%, and enrolment for ages 3 and above rising by 5 points to 85%.
- The majority of students in vocational upper secondary education follow programmes that grant full access to tertiary education, with 76% of students enrolled in such programmes on average across the OECD.
- Completion rates for bachelor’s programmes increase after the theoretical duration of programmes: on average, 44% of students graduate on time, compared to 69% three years after.
- Students from Asia form the largest regional group of internationally mobile students in tertiary education, representing 58% of all foreign or international students across the OECD in 2023.
- Only 43% of students complete a bachelor’s degree within the expected duration, though this rises to 59% with one additional year and 70% with three additional years on average across the OECD.
Visualisations
Click the arrow sign next to the title:
to display other variables
to display other variables
Click the arrow sign next to the title:
to display other variables
to display other variables
Click the arrow sign next to the title:
to display other variables
to display other variables
- Governments spend on average USD 12 438 per student in primary, secondary and post-secondary non-tertiary education, and USD 15 102 per student in tertiary education including R&D.
- Expenditure per student has risen in absolute terms since 2015, but its share in public budgets has declined, with government spending on education at almost 15% of total government expenditure on average in 2022.
- Annual spending per student at primary and secondary levels varies widely across OECD countries, from under USD 3 000 in some systems to over USD 25 000 in the most highly funded ones.
- Tertiary education continues to expand, placing pressure on public budgets. Private sources represent a larger share of total funding at the tertiary level than at any other level of education.
- Spending per student differs markedly between public and private institutions, with expenditure in public tertiary institutions exceeding USD 33 000 in some countries, compared to less than USD 10 000 in others.
Visualisations
Click the arrow sign next to the title:
to display other variables
to display other variables
Click the arrow sign next to the title:
to display other variables
to display other variables
Click the arrow sign next to the title:
to display other variables
to display other variables
- Students in OECD countries receive an average of 7 604 hours of compulsory instruction during primary and lower secondary education, with total hours ranging widely across education systems.
- Compulsory instruction time averages 804 hours per year for primary students and 909 hours for lower secondary students, a difference of about 105 hours annually.
- The ratio of children to teachers in pre-primary education has fallen across most OECD countries, decreasing from an average of 15 children per teacher in 2013 to 13 in 2023.
- Teachers’ statutory salaries increase with the level of education taught. On average, teachers with 15 years of experience earn USD 55 725 at pre-primary level and USD 63 925 at upper secondary level.
- Teachers’ actual salaries are 83–91% of the earnings of similarly educated tertiary-educated workers, while school heads usually earn more than tertiary-educated workers on average across OECD countries.
- The ratio of students to academic staff is lower in public than in private institutions, averaging about 14 students per staff member in public tertiary institutions compared to 18 in private ones.
- Nearly half of OECD and partner countries operate non-selective admission systems for first degrees, providing broad access to tertiary education, while entrance exams and centralised systems are also common.
- The salaries of academic staff in tertiary education vary by seniority. On average, junior staff earn about 62 000 USD, while senior staff earn about 108 000 USD.
| Education policies: Teachers | Education policies: Teachers | OECD Teaching and Learning International Survey (TALIS) |
Visualisations
Click the arrow sign next to the title:
to display other variables
to display other variables
Click the arrow sign next to the title:
to display other variables
to display other variables
Click the arrow sign next to the title:
to display other variables
to display other variables
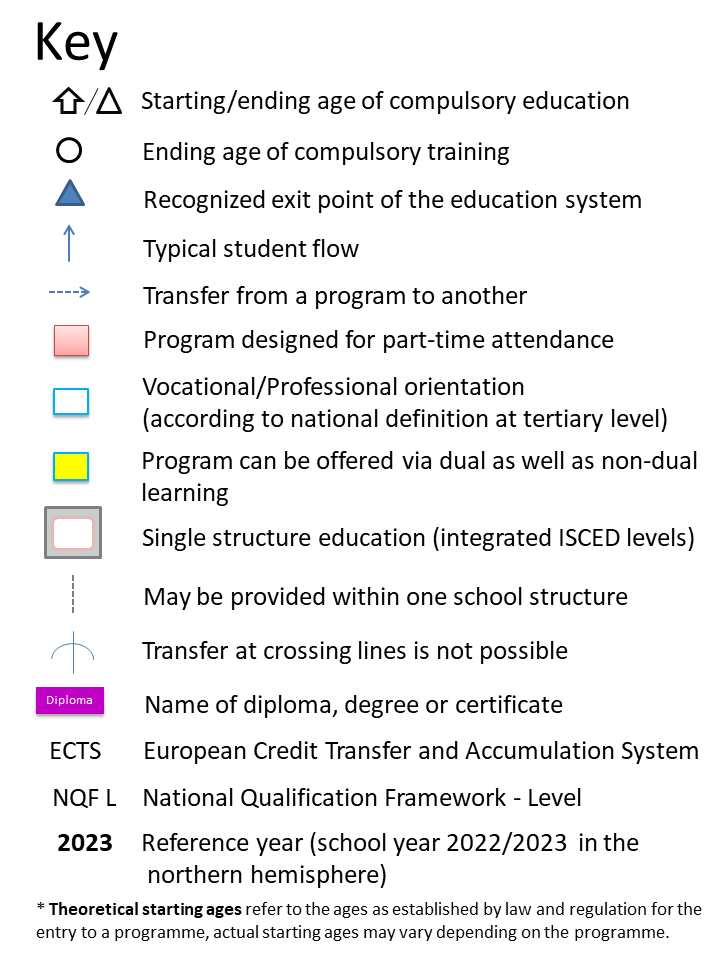
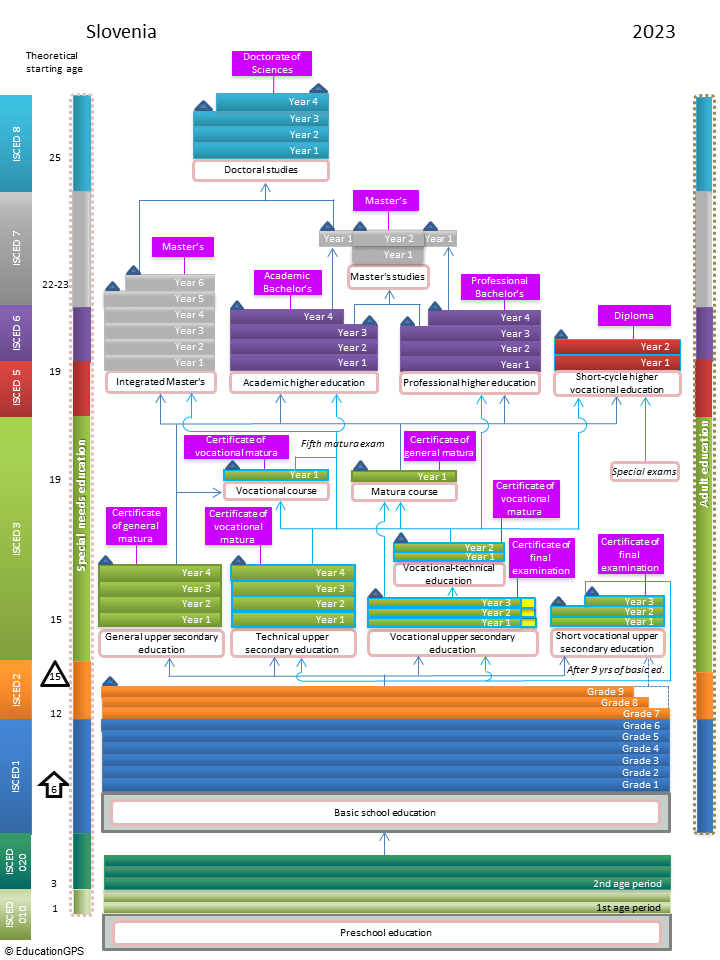
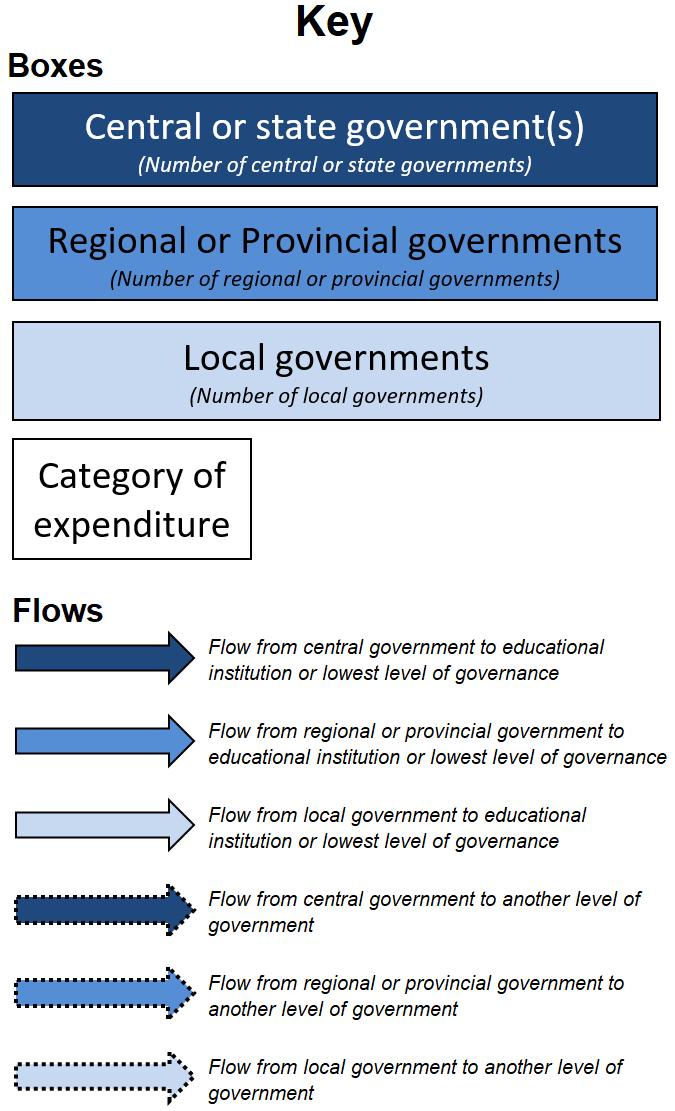
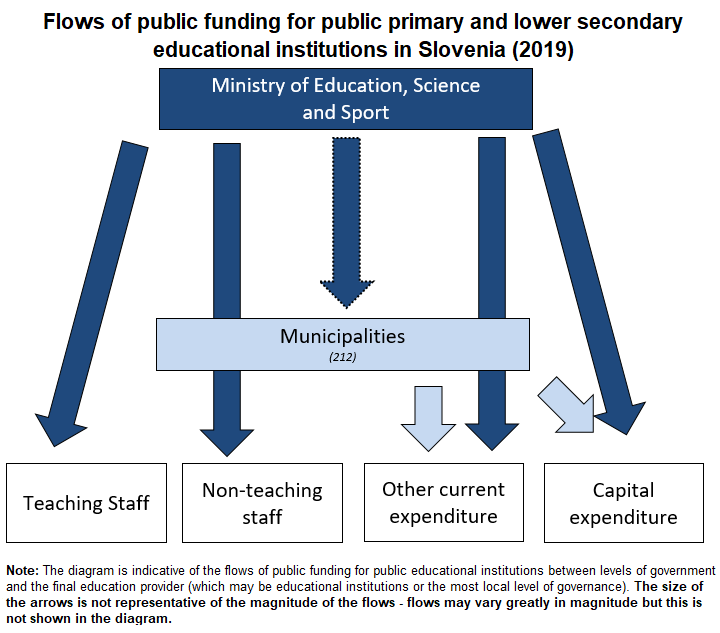
Click on the diagram to get a PDF version
Click on the coverpage to see the full OECD iLibrary version


Note: These values should be interpreted with care since they are influenced by countries' specific contexts and trade-offs. In education, there is often no simple
most- or least-efficient model. For instance, the share of private expenditure in education must be read against other measures designed to mitigate inequities,
such as loans and grants; longer learning time is an opportunity to convey more and better content to students, but may hinder investments in other important
areas. If you want further information on the nature of different variables, please take the time to read the analysis and contextual information, available at the website
for each publication.
All rankings for individual variables are compiled on the basis of OECD and G20 countries for which data are available. The OECD average includes only OECD countries which are listed here: https://www.oecd.org/en/about/members-partners.html
Reference years displayed in the Education GPS correspond to the most common year of reference among countries for which data is available on each variable. Data for the latest available year is preferred and some countries may have provided data refering to a more recent or late year. To know more about possible exceptions on data please click on the "Download Indicator" link on each variable. When a year of reference corresponds to a school year encompassing two years, the reference reads as follows: 2026 for school year 2025/2026.
*TALIS averages are based on all countries participating in the TALIS survey, including partner countries and economies. This explains the difference between the OECD average and the TALIS averages. Data from the TALIS survey and Education at a Glance (EAG) may differ. See Annex E of the TALIS technical report and Annex 3 of EAG 2024 for more details about the data collections.
For additional notes, please refer to annexes in the list of links below the introductory country profile text.
All rankings for individual variables are compiled on the basis of OECD and G20 countries for which data are available. The OECD average includes only OECD countries which are listed here: https://www.oecd.org/en/about/members-partners.html
Reference years displayed in the Education GPS correspond to the most common year of reference among countries for which data is available on each variable. Data for the latest available year is preferred and some countries may have provided data refering to a more recent or late year. To know more about possible exceptions on data please click on the "Download Indicator" link on each variable. When a year of reference corresponds to a school year encompassing two years, the reference reads as follows: 2026 for school year 2025/2026.
*TALIS averages are based on all countries participating in the TALIS survey, including partner countries and economies. This explains the difference between the OECD average and the TALIS averages. Data from the TALIS survey and Education at a Glance (EAG) may differ. See Annex E of the TALIS technical report and Annex 3 of EAG 2024 for more details about the data collections.
For additional notes, please refer to annexes in the list of links below the introductory country profile text.